

Sofia Babanova,1 JasonJones,1SujalPhadke,2MengqianLu,1CarloAngulo,3 Jaime Garcia,3 Kayla Carpenter,2 Rachel Cortese,2 Shing Chen,1 Tony Phan,1 Orianna Bretschger1*
1Aquacycl LLC, San Diego, California
2J. Craig Venter Institute, La Jolla, California
3D4C Product Development, San Diego, California
Received 5 April 2019; Revised 25 June
2019; Accepted 29 June 2019 Roddenberry Foundation
Additional Supporting Information may be found in the online version of this article.
Correspondence to: Orianna Bretschger, Aquacycl LLC, San Diego, CA.
Email: obretschger@aquacycl.com
*WEF Member
DOI: 10.1002/wer.1183
© 2019 Water Environment Federation
Abstract
Microbial fuel cells (MFCs) have long held the promise of being a cost‐effective tech- nology for the energy‐neutral treatment of wastewater. However, successful pilot‐ scale demonstrations for this technology are still limited to very few. Here, we present a large‐scale MFC system, composed of 12 MFCs with a total volume of 110 L, for the treatment of swine waste at a small educational farm. The system was operated for over 200 days in continuous mode with hydraulic residence time of 4 hr. Very stable electrochemical and waste treatment performance was observed with up to 65% of chemical oxygen demand (COD) removed and a maximum treatment rate of 5.0 kg COD/m3.day. Robust microbial enrichment was performed and adapted to metabolize and transform a diversity of compounds present. The Net Energy Recovery (NER = 0.11 kWhr/kg COD) is not only competitive with conventional cogeneration processes, but is in fact sufficient to sustain the operational energy requirements of the system. © 2019 Water Environment Federation
- Practitioner points
- This study demonstrates the design and operation of a large‐scale microbial fuel cells (MFC) system for continuous treatment of swine wastewater.
- The system achieved a high chemical oxygen demand removal rate within a short hydraulic residence time.
- This study moves one‐step closer to applying MFC technology for real wastewater treatment.
- Keywords: microbial fuel cells; pilot‐scale demonstration; swine wastewater; wastewater treatment
Introduction
Microbial fuel cells (MFCs) use microbes as catalysts to oxidize organic matter at the anode and generate electricity via extracellular electron transfer (EET) mechanisms. The development of MFC technology has benefited from major discoveries related to EET mechanisms of model organisms, critical design evaluations, and transformation from laboratory scale fundamental experiments to large‐scale pilot demonstrations. However, the latter are still scarce, mostly empirical and under initial development stages.
To demonstrate practical treatment of swine waste, large‐scale MFC systems are needed to treat real wastewater under continuous flow operation over longer time scales outside of a laboratory setting. Further, MFC systems must demonstrate to have a low cost of fabrication and long‐term operational reliability. In recent years, there has been increasing efforts focused on scaling‐up MFCs for wastewater treatment. Stacking multiple MFC modules has been shown as a strategy for scaling up, since it allows for larger total volume capacity while each single reactor can function and be maintained independently. Zhuang, Yuan, Wang, and Zhou (2012), Zhuang, Zheng, et al. (2012)) built a serpentine‐type MFC with a 10 L working volume and reached 87.1% COD removal efficiency while treating brewery wastewater at a hydraulic retention time (HRT) of 48 hr. Ge et al. built an MFC system with 200 L liquid volume by stacking 96 tubular MFC modules and reached 76.8% COD removal efficiency treating munici- pal wastewater at an HRT of 18 hr (Zhuang, Yuan, et al., 2012; Zhuang, Zheng, et al., 2012).
Few research efforts have been focused on treating swine wastewater using MFC technology, compared to other types of wastewaters. Significant volumes of swine wastewater are accu- mulated and discharged in the sewer during the daily washing and sanitation of animal pens in pig farms. During these pro- cesses, a vast amount of freshwater is consumed. Approximately one quarter of global freshwater is used for animal production (Parente & Lewis‐Brown, 2011). According to a 2011 report by the Pork Checkoff organization, a given swine farm may use 24% of its total water consumption for facility operations such as cooling the animals and manure management (Matlock et al., 2011). The most common method of manure management at swine production operations is to capture the wastewater in large anaerobic lagoons (Matlock et al., 2011). However, if not properly lined or maintained, these lagoons may lead to haz- ardous discharge causing severe environmental impacts due to the release of high concentrations of carbon, nitrogen and phosphorous, and the presence of potentially pathogenic bacte- ria. Therefore, alternative treatment methods that accelerate the removal of carbon and nitrogen from swine wastewater could enable water reuse for farm cleaning and/or irrigation while simultaneously preventing environmental pollution.
Bioelectrochemical systems have successfully demon- strated the treatment of swine wastewater at the laboratory scale (Egbadon et al., 2016; Ichihashi & Hirooka, 2012; Kim, Dec, Bruns, & Logan, 2008; Kim, Yang, Evans, & Logan, 2016; Lim, Park, Kim, & Shin, 2012). Min, Kim, Oh, Regan, & Logan (2005) were the first to report the possibility of swine waste- water treatment using a single‐chamber MFC in year 2005. A following report by Lim et al. in 2012 described the use of a modified ion exchange biological reactor, which evaluated the use of ion exchange membranes in combination with bioelec- trochemical reactor (IEBR) for treatment of swine waste. The IEBR was a three‐chambered system with a total volume of 6 L (2 L per chamber) that was operated continuously with swine waste for 64 days at a HRT of 5 days. The authors reported a 67% soluble chemical oxygen demand (SCOD) removal at 2 V applied voltage over the 5‐day treatment period. The SCOD removal was accompanied with a 59% removal of nitrogen.
Zhuang, Yuan, et al. (2012), Zhuang, Zheng, et al. (2012)) developed a stack of five tubular, single‐chambered MFCs hydraulically connected in series and electronically connected in parallel or series. This MFC stack was constructed with a 1.5 L total volume (295 ml per MFC) and was reported to con- tinuously treat swine wastewater over 300 hr (12.5 days) at a hydraulic residence time (HRT) of 60 and 230 hr, with organic loading rates of 1.2 and 4.9 kg COD/m3 day, respectively. The authors reported COD removal efficiencies of the stack to be between 80% and 90% for both loading rates.
Kim et al. (2008) explored the use of microbial fuel cells for odor and ammonia removal from swine wastewater. This effort treated high‐strength swine wastewater with a SCOD removal efficiency up to 84%, demonstrated odor removal, a treatment rate of 0.02 kg COD/m3 day, and a maximum power density of 228 mW/m2. These treatment performance metrics were achieved in 0.10 L reactors, operated in a fed‐batch mode with a 250‐hr (10 days) HRT. Recently, the same research group evaluated two single‐chamber systems (0.10 L each, 0.20 L total volume) in hydraulic series for the continuous treatment of high‐strength wastewaters (Kim et al., 2016). Their system was operated continuously over 185 days with an HRT of 16.7 hr and demonstrated a COD removal efficiency of 59%, a treat- ment rate of 6.3 kg COD/m3 day, and a maximum power of 750 mW/m2.
Ichihashi and Hirooka (2012) used a single‐chamber MFC with a 70 ml total volume to remove and recover phos- phorus as struvite from swine wastewater. The current and power densities observed from this study were some of the highest reported with swine waste (7.0 A/m2 and 2.3 W/m2) along with some of the highest COD loading (60,000 mg‐ COD/L). The system was operated for 76 days, and the COD removal efficiency in this case was up to 91%. Another high COD removal efficiency of 86% was reported from Egbadon et al. (2016), who used a dual‐chamber MFC with ferricya- nide as a catholyte and a total working volume of 1.0 liter. The system was operated in batch mode with a HRT of 21 days. The achieved power density was 88 mW/m2 at an initial COD loading of 5.4 g/L. However, to our knowledge there have been no reports of a pilot‐scale MFC system treating swine wastewater at high flow rates in a farm application. The above‐ mentioned studies are still at a small scale (up to 10 L) with impractical materials selection and design, usually operated under batch mode for a short period of time. The systems are not engineered with scalability, manufacturing, and cost in mind, which are very important parameters for large‐scale sys- tem design. In addition, from a commercialization perspective, treatment time and maintenance requirements are also of sig- nificant importance. Fast treatment times (HRTs in the range of hours as opposed to days), improved stability, and reduced maintenance requirements are desirable factors for technology commercialization and competitiveness.
Here, we report the first pilot‐scale (110 L) MFC sys- tem for continuous treatment of swine waste at a small farm, demonstrating treatment at flow rate of 660 L/day (174 gpd) for over 200 days of operation. The results from this demon- stration suggest the practical utility of MFCs for swine waste- water treatment and energy recovery and provide a basis for exploring MFC treatment in other agricultural and industrial applications.
Materials and Methods
MFC design
Each MFC reactor had a rectangular shape with internal dimen- sions: 31 cm × 17 cm × 15 cm, and volume of 7.9 L. The anode was composed of twenty graphite fiber brushes (Hutchinson, Tokash, & Logan, 2011), each with a 10 cm height and 2.5 cm diameter. All carbon brushes were connected in series as one electrode. Before use, all anodes were soaked with acetone for 1 hr to remove organic contaminants and washed thoroughly with DI water. Two gas diffusion cathodes (13.5 cm × 27.2 cm, geometric surface area 367 cm2) were placed on both sides of the reactor and connected in series. Flow guides were built into each reactor to direct flow of the solution inside the reactors (Figure S1).
Pilot site design
Twelve MFC reactors were connected in series with a consecutive flow of the solution from Reactor 1 to Reactor 12 (Figure S2).
The overall volume of the system was 110 L. The waste stream was gravity‐fed into the reactors through the utilization of an elevated feeder box, and a peristaltic pump was used to control the outflow rate. During continuous mode of operation, the waste solution was prepared and stored in an underground sump (5,700 L) and transferred into the feeder box with a cavi- tation pump. The sump was regularly agitated to avoid settling of the organic solids. However, agitation was mild enough so as to not aerate the wastewater. The measured dissolved oxy- gen of the sump feed was consistently below detection limit (LOD = 0.01 mg/L). Treated effluents from the MFC system was discharged to sanitary sewer.
Pilot inoculation and operation
The pilot site was located at the Agriculture Center at San Pasqual High School (Escondido, CA), a part of the Escondido Union High School District, and was installed as both a tech- nology demonstration program and as a hands‐on science opportunity for the students. The reactors were installed out- side with only a shade structure and so were exposed to the environmental variables of temperature, humidity, wind, and dust throughout operation (Figure S3).
Stock swine waste solution preparation and pilot inoculation. The stock swine waste solution was prepared from pig excrements collected from a small pig farm located at San Pasqual High School, Escondido, CA. The pig excrements were mixed with tap water and blended to grind the solid waste into smaller particulates. The swine waste suspension was then screened through a stainless steel mesh (2 × 2 mm). The concentrated swine waste solution (50,000–80,000 mg/L chemical oxygen demand [COD]) was then added to the feeder box during batch mode or to the sump during continuous mode.
The system was inoculated with carbonate buffer, lagoon sediment, and stock swine waste solution. The system was first filled with 110 L of 30 mM carbonate buffer. Lagoon sediment (0.5 L) was separately mixed in 30 mM carbonate buffer to final volume 5.5 L and introduced into the feeder box along with the 2.9 L stock swine waste solution.
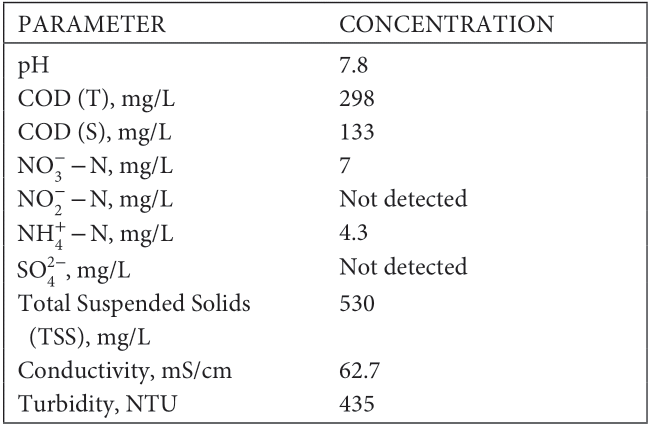
The chemical composition of the swine wastewater used for inoculation is shown in Table 1.
Pilot operation. For the first 30 days, the system was operated in a batch mode with recirculation of the inoculum solution through the feeder box and the reactors at a flow rate of 1.9 L/min. The COD level during the initial 14 days of operation was maintained on average at approximately 1,000 mg/L by daily additions of 1.5 L stock swine waste solution to the feeder box. After 2 weeks, additional stock swine waste solution of 1.5 L was introduced to the system once a week for the remaining of the batch mode.
After 30 days, the operation was switched from batch to continuous flow mode. The sump was filled with swine waste solution (COD [T] ~ 1,000 mg/L) in 30 mM carbonate buffer (pH 7.5). The flow rate was 0.38 L/min.
Each reactor was electrically monitored separately. The anode and the cathode of each reactor were initially connected to a 47,000 Ω resistor, and the resistor magnitude was suc- cessively lowered to 100 Ω. Detailed description of resistance adjustments for the duration of the study is listed in Table S1.
The operational resistance was selected based on period- ically performed polarization measurements. It was chosen to correspond to the maximum power point from the power curves.
Electrochemical characterization
The voltage (V) across an external resistor for each reactor was monitored in 10 min intervals using a data logger (Graphtech GL820). The reactors were periodically disconnected to meas- ure open circuit potential (OCP) of the electrodes, perform polarization curves, or electrochemical impedance spectros- copy (EIS).
Polarization measurements were carried out once per week by varying the external resistance from open circuit to 3 Ω in 5 min intervals. The voltage of the reactors as well as the electrodes potentials were measured with each resistor applied. Current (I) and power (P) were calculated using Ohm’s law (I = V/R and P = V*I). The potentials of the anode and the cathode were measured against an Ag/AgCl reference elec- trode. The volumetric system current and power densities were calculated by normalizing the current and power to the total volume of all reactors (0.09 m3).
The current and power densities of each individual reactor were calculated as the current of the reactor normalized to the cathodes geometric surface area (0.0734 m2).
Electrochemical impedance spectroscopy of the reac- tors were carried out periodically at OCP from 100,000 Hz to 0.1 Hz with 5 mV applied AC voltage.
Chemical analyses
Chemical oxygen demand (COD), sulfate, nitrate, and nitrite of influent and effluent samples were periodically analyzed using Hach DR850 and DR900 instruments and associated methods. Total suspended solids (TSS) were quantified using EPA method 160.2. Dissolved Oxygen (DO), pH, and ammonium were periodically measured on site by Hach HQ40d portable meter equipped with pH, LDO (LDO10101 IntelliCAL), and ammonium (ISENH4181 IntelliCAL) probes.
Chemical oxygen demand removal rate, COD removal efficiency, TSS removal efficiency, TSS loading, and biomass produced were calculated as indicated in the Supplemental Information.
Microbial composition analysis
Effluent samples were collected periodically during the experi- ment to extract DNA and evaluate the microbial taxonomic composition of the effluents. In addition, before the inocula- tion, samples were collected from the lagoon sediment, swine waste solution, and mixed inocula. Samples were also collected from the anode and the cathode surfaces of reactor 6, which was decommissioned after 140 days of operation. Genomic DNA was extracted from each sample using the PowerBiofilm® DNA Isolation Kit (P/N 24000–50; MO Bio, Carlsbad CA) according to manufacturer instructions, with some minor modifications. PCR was used to obtain libraries of 16S rRNA locus using the primers 357F (5’‐CCTACGGGAGGCAGCAG‐3′) and 926R (5′-CCGTCAATTCMTTTRAGT‐3′) and standard Illumina adapters. The amplicon libraries were sequenced using Illumina Miseq 2X150bp paired end technology. The raw reads were qual- ity filtered and analyzed using QIIME 1.0 to identify and remove chimeric sequences and perform taxonomic classification.
To evaluate the microbial populations associated with the anodes, cathodes, and residual sludge at day 105, we decom- missioned a single reactor (reactor 6). Samples were extracted from each anode brush, at the top and bottom. Six samples were also extracted from both left and right cathode at different loca- tions of flow (in, middle, and outflow) as well as the top and the bottom of each section.
Scanning electron microscopy (SEM) imaging
During the MFC 6 decommission, small sub‐sections of anodes and cathodes were collected and immediately immersed in 2.5% glutaraldehyde in 1 M PBS buffer and stored at 4°C. Before the SEM imaging, the samples were washed and dehy- drated in 0%, 10%, 25%, 50%, 75%, and 100% ethanol, diluted with PBS solution as needed. Then, the samples were dried with a critical‐point drier and sputtered with an Iridium layer. The coated samples were examined with a SEM (FEI XL30 SFEG) at 3 kV.
Results and Discussion
Microbial fuel cell performance
Current generation. Right after inoculation each reactor was connected by a 47,000 Ω resistor. The immediate response of the reactors was a voltage of ~0.1 V, which is most likely due to the accumulated electrochemically active compounds in the swine wastewater or stored charge in bacteria. After the initial discharge and drop, the voltage of each reactor gradually increased to ~0.3 V on day 2 to 0.6 V on day 6. The start‐up time of the system was shorter than what had been reported by Min et al. (2005) in their single‐chamber MFCs run on concentrated swine waste, or by Molognoni et al. (2016) in their MFC using the maximum power point tracking (MPPT) strategy. A fluctuation in the generated voltage following the day and night cycles can also be seen.
During the enrichment phase, the system was operated under batch mode with daily feeds to maintain a relatively con- stant level of COD (~1,000 mg/L). The goal of this phase was to develop a robust and functionally selective microbial com- munity at the anode surface, to prepare the system for contin- uous flow‐through. Therefore, to provide enough energy for bacterial growth and biofilm development, the reactors were initially connected through a high resistor of 47,000 Ω, which was switched to 4,700 Ω during the second week. The following resistors were selected based on cell polarization measurements where the most efficient resistor was the one corresponding to the maximum power from the polarization curves. Thus, after week two, the electrodes were polarized to provide the selective pressure for electroactive bacteria.
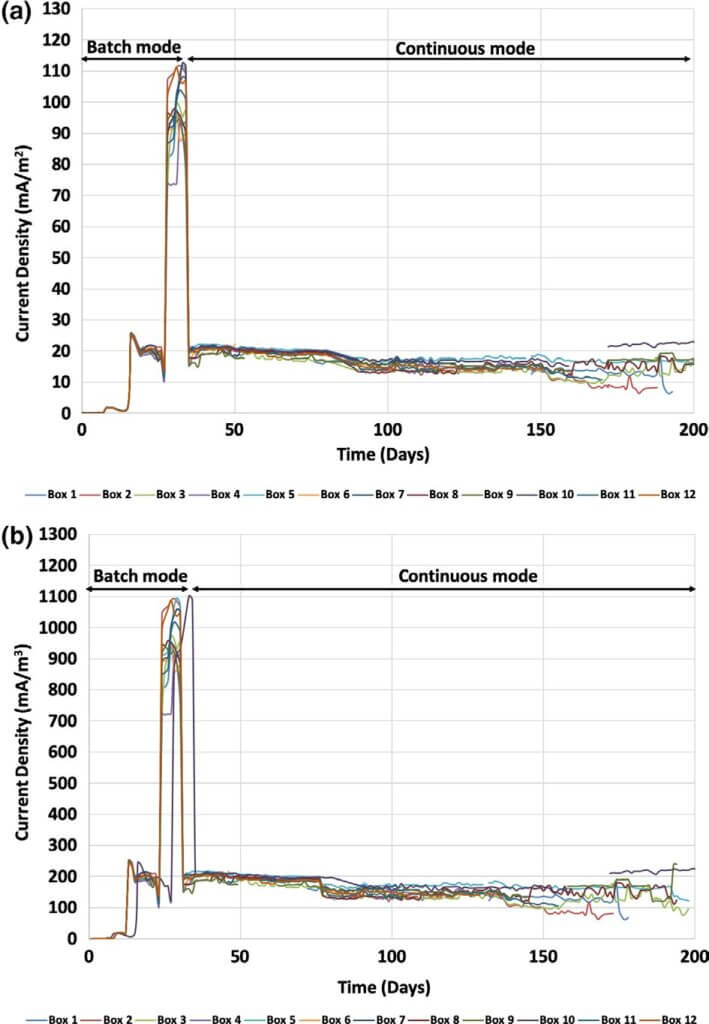
The generated current was used as an indicator of the per- formance of each reactor (Figure 1). All reactors had similar electrochemical performance. For example, the average current density at day 100 was 14.9 ± 1.4 mA/m2 (186 ± 10 mA/m3), with a relative standard deviation (RSD) of 5%, indicating very good reproducibility and identical reactor performance. No trend was observed in ascending or descending current along the series of reactors. The series of MFCs used by Zhuang, Yuan, et al. (2012), Zhuang, Zheng, et al. (2012)) to treat swine waste showed increasing electrochemical output from MFC1 to MFC5. This was suggested to be a result of the increased amount of volatile fatty acids (VFAs) available in the later MFC units and the different microbial community. This pattern was not observed in the current study, which might be due to the shorter HRT and the amount of VFAs (500–600 mg/L) already available in the raw swine wastewater. We hypothesize that the rate of VFA oxidized at the electrode surface does not signifi- cantly exceed the rate of VFAs released during fermentation providing comparable VFA concentration in the MFCs, which explains their comparable electrochemical performance.
A maximum current density of 103 ± 7 mA/m2 (1,011 ± 73 mA/m3) was achieved under the 47 Ω resistor and corresponds to 37 ± 5 mW/m2 (362 ± 52 mW/m3). This cur- rent density is lower than the current densities reported by Kim et al. (2016) (500–600 mA/m2) with a 50 Ω resistor and significantly higher COD loadings (7–8 g/L COD). Another MFC treating high‐strength swine wastewater (~8 g/L COD) produced 228 mW/m2 at 1,000 Ω (Kim et al., 2016). The rela- tive lower electrochemical performance of the reactors herein might be due to the markedly lower COD loadings.
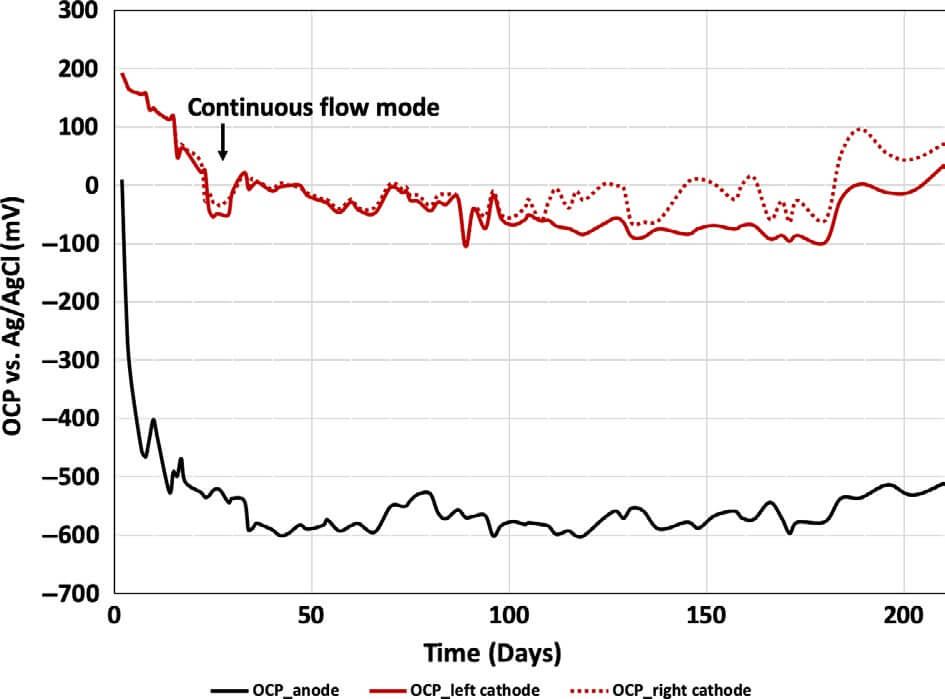
Electrodes open circuit potential. The OCP of the anode and cathode electrodes were also monitored on a regular basis. To do that, the reactors were disconnected from the applied resistor for one hour before OCP measurements allowing the electrodes potential to reach equilibrium.
Figure 2 shows the OCP of the anode, and the left and right cathodes of reactor 5 as a representative reactor. As can be seen, the anode developed a stable electrochemical poten- tial in 35 days, which stayed constant for the remainder of the operation. At the same time, the OCPs of the two cathodes decreased from 183 ± 6 and 182 ± 7 mV to −33 ± 40 and −22 ± 17 mV for the left and right cathodes, respectively. The sharp decrease in the cathodic performance was likely due to the higher polarization when the system was operated at 47 Ω although the system showed the highest energy recov- ery at this point. Therefore, the resistance was switched back to 330 Ω and later decreased to 100 Ω. Prolonging cathode operation was of a major importance since in most of the long‐term studies reported to date, the cathodes were the elec- trodes that failed over time and required repair or replace- ment (Kim et al., 2016). Since the overall goal of the current pilot study was organics removal and wastewater treatment, not maximized energy harvesting operating the system with sub‐optimal energy generation conditions was acceptable.
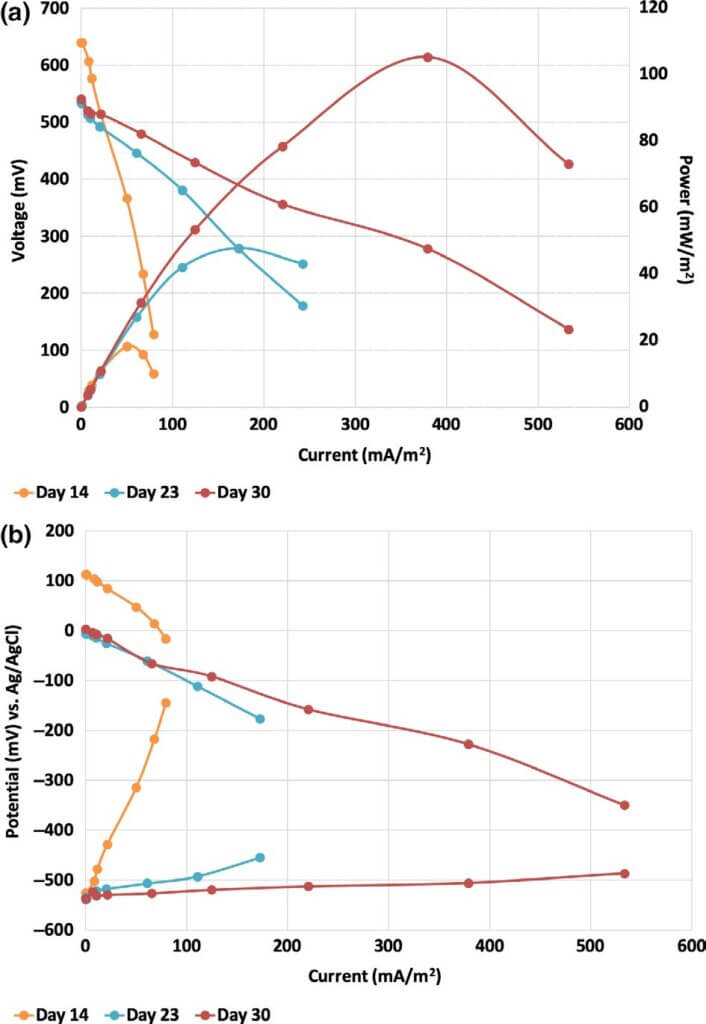
Polarization measurements. The electrochemical performance of the reactors increased during batch mode due to the gradual anode development (Figure 3). The maximum power increased from 18 to 105 mW/m2 (133–1,067 mW/m3) from day 14 to day 30, accompanied by a 6.5‐fold improvement of the generated current from 79 mA/m2 (800 mA/m3) at day 14 to 533 mA/m2 (5,200 mA/m3) at day 30. Although the OCP of the anode did not change significantly (−533 ± 6 mV vs. Ag/AgCl) during batch mode, the ability of the electrogenic community to transfer charge to the anode surface was significantly increased. It is notable that the overall electrochemical output of the reactor was determined by the anode performance during batch mode of operation.
The maximum power determined through cell polariza- tion and power curves at day 30 was 2 times higher than the Pmax (261 mW/m2) recorded by Min et al. (2005) in their single‐ chamber MFCs treating concentrated swine wastewater.
Different behavior was observed when the system was operated under continuous flow (Figure 4). During contin- uous mode, the reactors showed power output in the range of 84–105 mW/m2 (800–933 mW/m3) at 339–379 mA/m2 (3,333–4,000 mA/m3) from day 30 until day 150 when the COD loading was decreased to 500–600 mg/L COD(T). Due to the lower organic content, the electrochemical output decreased to 53–64 mW/m2 (533–667 mW/m3) of power at approximately 273 mA/m2 (2,667 mA/m3).
Min et al. (2005) demonstrated that the power output of a single‐chamber MFC treating swine waste had a Michaelis– Menten relationship with respect to wastewater concentration. The Michaelis–Menten constant for the study of Min et al. was 1,510 mg/L COD(T), which is higher than the COD loading (1,000 mg/L) until day 150, and three times higher than the COD loading after day 150. Therefore, a decrease of the electro- chemical output of the MFCs can be expected as a function of the decreased COD loading.
A constant and slight decay in the current was recorded after day 150 because of decreased electrode performance as seen in the polarization curves of the anode and cathode from reactor 5 (Figure 4c). Over time, the anodic potential became less negative, but the anode still possessed stable polarization. The cathode suffered from higher potential losses compared to the anode and in general dictated the generated current.
The observed maximum power densities at ~1,000 mg/L COD loading are comparable to those reported by Zhuang, Yuan, et al. (2012), Zhuang, Zheng, et al. (2012) for their best perform- ing MFCs. However, the Zhuang et al. study was conducted with an MFC HRT of 60 hr or 230 hr. The current study results were accomplished in a 4 hr HRT under continuous mode.
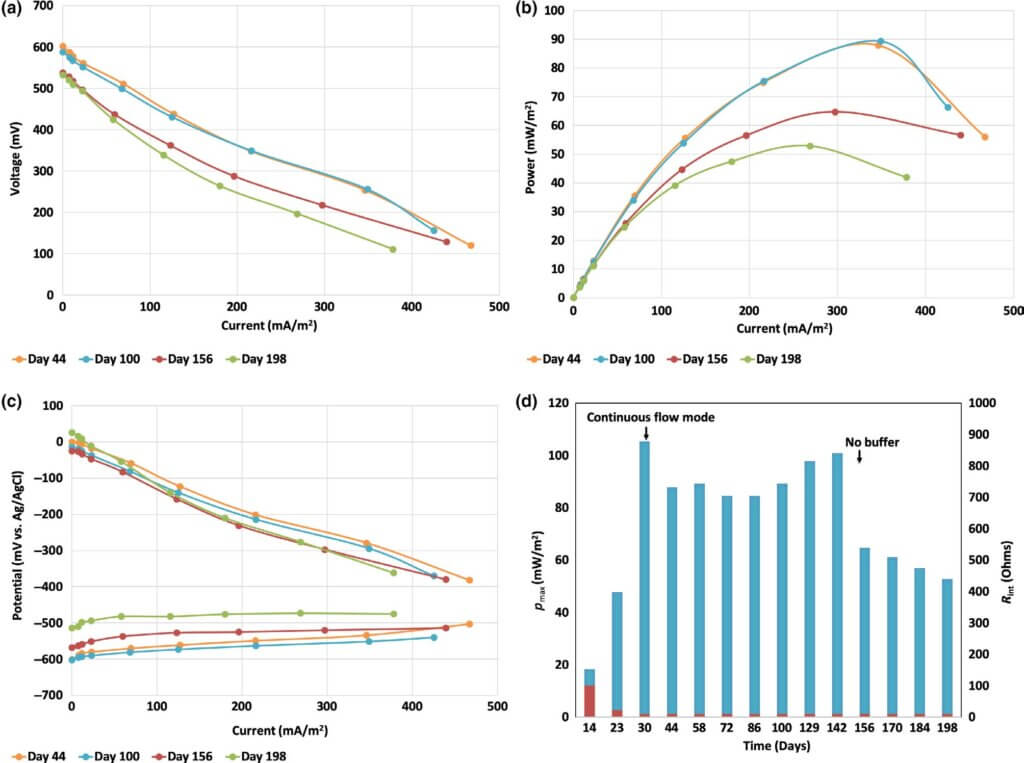
Figure 4d shows the maximum power for reactor 5, deter- mined through cell polarization and power curves. During batch mode, the maximum power of the reactor was low due to the undeveloped anode. After it reached day 30, the maximum power stayed around 92 ± 8 mW/m2 (905 ± 78 mW/m3) until day 142, after which it ultimately decreased to 53 mW/m2 (519 mW/m3) measured day 198. In general, higher Pmax was recorded at higher COD loading rates, which is expected since the current and power are extracted from the oxidation of the organic material.
The internal resistance of the reactor determined from the slope of the polarization curves was 100 Ω at day 14, 22 Ω at day 23, and stayed 10 Ω from day 30 to day 200 (Figure 4d). Therefore, the electrochemical performance of the reactors was not influenced by an increase of the reactors’ internal resis- tance. The accumulation of biomass in the reactors and at the electrode surfaces did not lead to an increase in Rint, which indicates that the reaction rates at the two electrodes were not changed during operation.
The decreased cathodic performance is usually consid- ered to be a result of decreased oxygen diffusion through the cathodes due to biofilm formation or salts accumulation. Kim et al. (2016) pointed out biofouling as the main reason for the decreased cathodic performance. After 185 days of operation, the maximum power generated from their reactors decreased by 80%–85%. This study did not show such a pronounced decline in the cathodic performance (Figure 4c) even though a thick biofilm was developed on the cathode surface. Ichihashi and Hirooka (2012) used a MFC for the recovery of phospho- rus as struvite on the cathode surface. They observed the for- mation of struvite precipitate on the cathode surface facing the solution. Struvite precipitates at basic pH, which is assumed to occur near the cathode surface due to generated hydroxide as a byproduct of oxygen reduction. No precipitate formation was visually observed in this study.
The decrease in cathodic performance in this study is hypothesized to be mainly due to competitive reactions occur- ring at the cathode surface such as sulfate or nitrate reduction.
EIS measurements. Electrochemical impedance spectroscopy of the anode was used to evaluate the charge transfer resistance at the anode (Figure S4). The starting anodic charge transfer resistance was 0.1 Ω and gradually increased to 1.2 Ω at day 205. The charge transfer resistance at the initial stages and at day 205 was very low, which indicates highly active and fast bacteria‐electrode interactions, that is, rapid extracellular electron transfer.
The solution resistance also increased slightly from 1.2 to 9.4 Ω due to decreased conductivity of the solution. The solu- tion was no longer buffered after day 150, and the COD loading decreased from 1,000 mg/L to 500 mg/L after day 110.
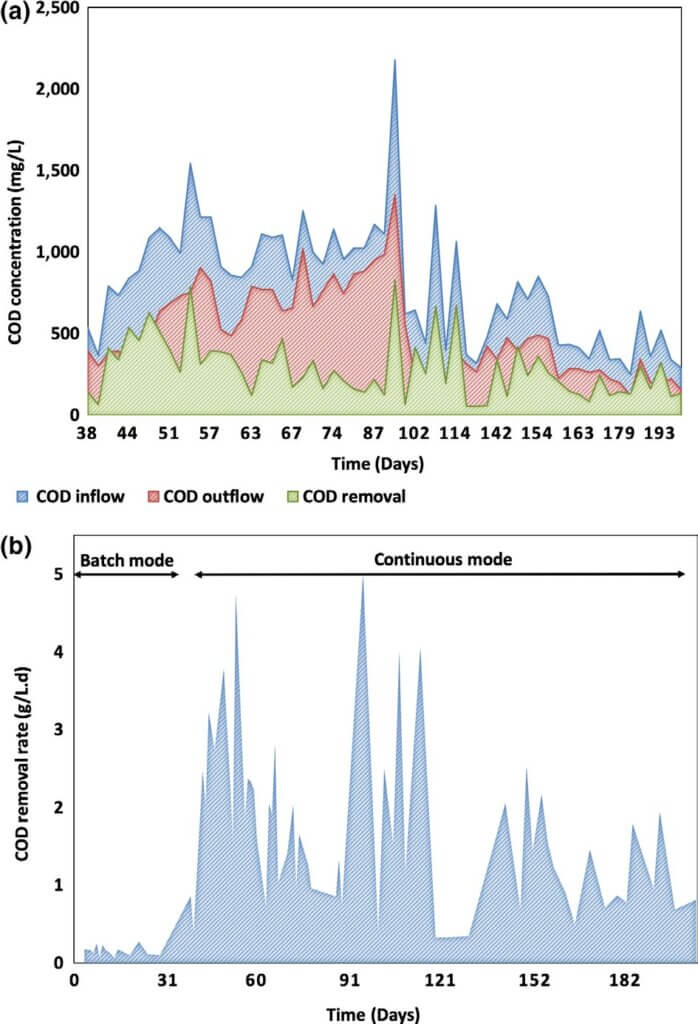
Chemical analysis of wastewater composition Chemical oxygen demand (COD). Samples for chemical analysis of the inflow and outflow of the system were taken periodically to evaluate the COD removal rate, as well as to determine the ability of the system to remove nitrogen and sulfur species. During the first 110 days, the target COD for the inflow of the system was 1,000 mg/L, after which it was decreased to approximately 500 mg/L. Figure 5 shows that on average, the higher instantaneous COD removal in mg/L was observed during the initial stage of continuous mode, when the COD loadings were higher. The organic removal rate of the system varied between 1–5 kg/m3 day, which is comparable to the removal rates demonstrated by small scale MFCs treating swine waste and current aerobic treatment technologies.
The COD removal rate constant was calculated based on the assumption of first‐order rate constant as: k (hr−1) = − ln (CODinflow/CODoutflow)/HRT, where CODinflow is the influent COD, CODoutflow is the effluent COD, and HRT is 4 hr (Kim et al., 2016). The COD removal rate constant at CODinflow ~1,000 mg/L was 0.112 ± 0.07 hr−1, and at CODinflow ~500 mg/L, k = 0.135 ± 0.07 hr−1. The rate constants at the two COD loadings were not significantly different at p = 0.01, which indicates that the COD removal in this study followed a first‐order reaction rate, and the rate of COD removal is depen- dent on the concentration of inflow COD. The first‐order rate constant calculated in this study is comparable with the con- stants determined for low‐strength domestic wastewaters and significantly higher than k of high‐strength swine wastewater used by Kim et al. (2016).
The maximum COD treatment rate of ≈5.0 kg COD/ m3 day was observed at day 95, where the COD loading was 2,200 mg/L. The maximum COD removal efficiency (65%) was seen on day 102. The lowest COD removal was recorded during the enrichment period when the system was under SHE, E fNO /NO = +350 mV vs. SHE, E fNO /N = +700 mV vs. batch mode.
Zhuang, Yuan, et al. (2012), Zhuang, Zheng, et al. (2012)) reported COD removal efficiency of up to 83% with COD loading of ~1,000 mg/L and HRT of 60 hr. Kim et al. (2016) showed COD removal efficiency comparable to this study at 59 ± 6% with 16.7 hr retention time. The authors of these stud- ies suggested that the high COD removal efficiency is mainly due to solids sedimentation in the reactors. In our study, we demonstrated 36 ± 15% COD removal efficiency under con- tinuous mode and HRT of 4 hr (Figure S5), and we did not observe significant solids sedimentation in the reactors over the course of operation. The highest COD removal efficiency achieved by our pilot system was 65% at different time points of operation.
An MFC used for odor removal demonstrated 84% COD removal under batch mode for 260 hr (Kim et al., 2016). The control MFC, kept under open circuit, already showed 53% COD removal because of anaerobic fermentation. Therefore, we can assume that the COD removal due to the operation of the MFC as a bioelectrochemical system is only 31% of the overall observed removal, which is comparable to the average removal rates in this study.
Table S2 compares the performance of different MFCs treating swine wastewater. The MFC system in this study has a significantly higher working volume and faster flow rate than previous studies, which is important for practical wastewater treatment. The COD removal efficiency reported here is one of the highest among the MFCs running under continuous mode. The current and power densities (per square cm) in this study are comparable to other studies; however, the net energy recov- ery (NER) observed in this study is significantly higher than other reports (Kim et al., 2016). The NER of the MFC system at 330 Ω was 0.11 kWhr/kg COD under continuous mode of operation, which is higher than the NER of anaerobic digestion with energy recovery from methane operating under the same HRT of 4 hr (0.04 kWhr/kg COD estimated from ref. United States Department of Agriculture, 2017). Due to the lower COD removal rates during batch mode, the NER was calcu- lated as 0.22 kWhr/kg COD with Coulombic efficiency (CE) of 27%. On average, the CE of the system under continuous mode was calculated as 7%; however, continuous mode demonstrated higher COD removal rates.
Nitrogen species. Nitrogen and sulfur are key contaminants in wastewater, and their removal is critical for sustainable wastewater reuse applications. Nitrogen is usually removed from wastewater through biological nitrification and denitrification steps (Lier, Mahmoud, & Zeeman, 2008; Mcilroy et al., 2016). Nitrification involves the oxidation of ammonium to nitrate with the participation of oxygen and nitrifying bacteria. Nitrate is further reduced to nitrite and ultimately to nitrogen gas. The electrons necessary for the denitrification process are usually provided by the oxidation of organic material. Denitrification (Scheme S1) can be performed either in solution or by consuming the electrons accumulated at the cathode where nitrate reduction will happen (E fNO /NO = +433 mV vs. SHE; Virdis, Rabaey, Yuan, & Keller, 2008). In an MFC, the denitrification reaction would typically occur at the cathode surface via (a) direct electron transfer from the cathode to microorganisms or (b) intermediate production of H2, which is further used by bacteria as an electron donor for nitrate reduction (Virdis et al., 2008). A competing reaction to denitrification reaction is the dissimilatory nitrate reduction to ammonium (DNRA) (Scheme S1).
The two possible processes for conversion of nitrate in an MFC are denitrification to nitrogen gas or DNRA (Kelly & He, 2014; Sander, Virdis, & Freguia, 2015). Due to the anaerobic conditions in the MFC reactors, nitrification of ammonium does not proceed; therefore, it is accumulated in the effluent. The latter process is what we see in our system, and therefore, DNRA is the main pathway for nitrate removal in the MFC system (Figure 6). When nitrate is present in the influent, it is rapidly reduced to ammonium. The nitrate removal efficiency was 60%–100% under continuous mode (Figure 6a). Nitrite was typically not present in swine wastewater or it was not pro- duced in measurable amounts during the treatment process (Figure 6b).
In all samples, the concentration of ammonium increased when the wastewater passed through the reactors. An increase in the ammonium content was observed to be 30%–40% on average, and up to 90% was recorded (Figure 6c). The latter is a clear indication of DNRA. It has been established that during heterotrophic nitrate reduction, DNRA can occur in solution at a high C/N ratio due to the high organic content, which translates into high electron donor content (van den Berg, Boleij, Kuenen, Kleerebezem, & Loosdrecht, 2016; Virdis et al., 2008). DNRA was shown to appear at the cathode of bioelec- trochemical systems inoculated with mixed denitrifying culture in an organics‐limited environment (Virdis et al., 2008). van den Berg et al. (2016) showed that DNRA bacteria dominate the microbial population in nitrate‐limiting conditions and denitrifiers appeared in higher abundance in a carbon‐limited environment.
Our system is a bioelectrochemical system with high C/N ratio, thus both mechanisms, heterotrophic and autotrophic, of DNRA can proceed and lead to the production of ammo-nium. The C/N ratio, calculated as COD/NO3 −N, for the current system was determined to be in the range of 28–380, far exceeding reported values for denitrification (Virdis et al., 2008). The results from the microbial composition analysis of the cathodes population showed the presence of Rhodocyclales, which are known as aerobic, denitrifying bacteria (Figure S7). Geobacter lovleyi was also found at the cathode surface in small abundance (<0.5%) and has been identified as a DNRA‐capa- ble species (Virdis et al., 2008). As a result of the neutral pH in the reactors, ammonium does not transform into ammonia and accumulates in the effluent.
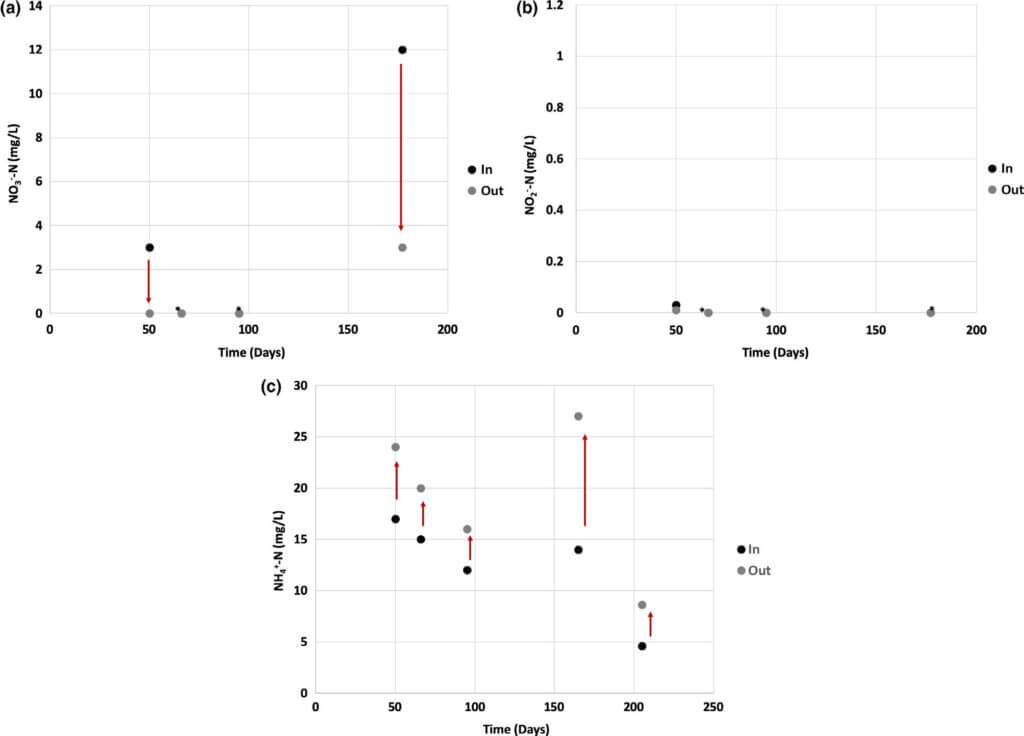
Other researchers using swine wastewater showed ammonium removal and an increase of the nitrate and nitrite concentrations most likely due to nitrification at the cathode surface due to the presence of oxygen (Egbadon et al., 2016; Min et al., 2005). Our system shows an opposite trend to what has been reported in the MFC literature to date. It should be noted that there is not an EPA regulation for ammonium concentrations; however, taste and smell limitations are in the range of 35 to 0.2 mg‐N/L, respectively. Nitrate and nitrite water quality limitations are 10 and 1 mg‐N/L, respectively. The nitrate and nitrite concentrations of the MFC effluents resulting from this study were consistently below the water quality limitations.
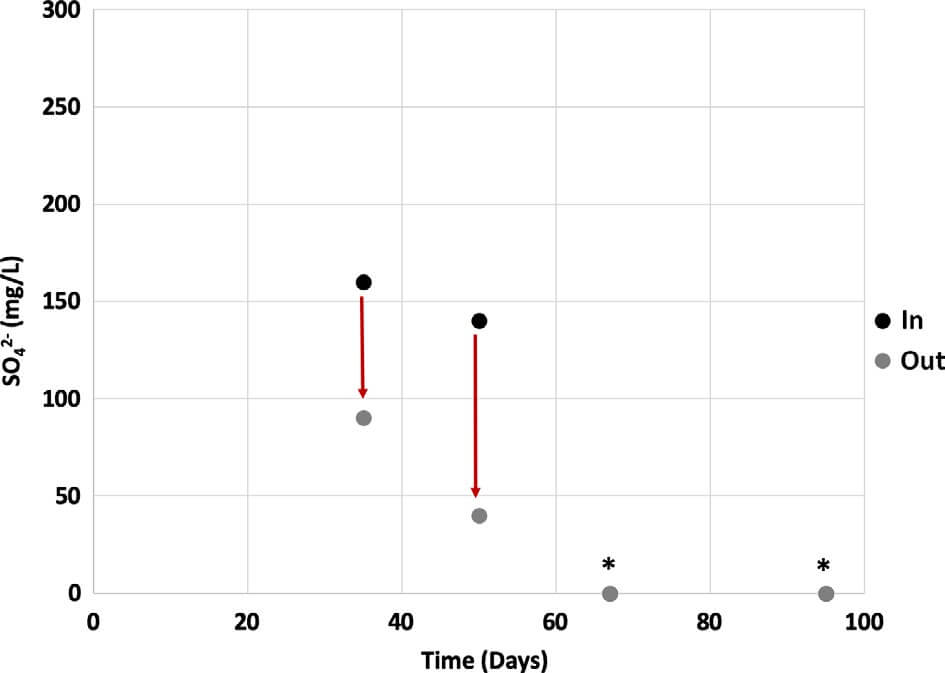
Sulfur species. Swine waste is not characterized by high sulfate content. The highest amount of sulfate measured in a concentrated swine waste solution was 250 mg/L and most of the time sulfate was not detectable. Sulfate removal up to 70% was demonstrated in our system (Figure 7). We believe that sulfate was reduced to sulfide although sulfide levels did not exceed 6 mg/L. Sulfate is regulated as a secondary contaminate, with a maximum contamination level of 250 mg/L. The influent and effluent from the MFC did not exceed this value over the course of operation.
Total suspended solids (TSS). One of the main disadvantages of aerobic wastewater treatment technologies is the significant production of biomass, which requires additional sludge management. For swine wastewater, the level of total suspended solids (TSS) is higher than domestic wastewater and ranges from 400 to 500 mg TSS/L versus <100 mg TSS/L for domestic wastestreams. For 4 hr of HRT, the TSS amount decreased by 50%–80% with the production of biomass <0.12% of the initial TSS loading. It was estimated that 270 ± 32 g/day of TSS are introduced into the system with 1.7 g/day build up as a biomass in the reactors. Regular maintenance (weekly) was conducted to remove sludge from the pipes; however, sludge accumulated in the reactors only required removal after 200 days of operation.
pH and dissolved oxygen. Major concerns of two‐chamber MFCs is the accumulation of protons in the anodic chamber causing pH to become acidic, and the depletion of protons and accumulation of hydroxide in the cathodic chamber, which leads to a basic environment. In a single‐chamber MFC this problem is usually not observed, but even in this design the MFC’s solution was still buffered for a time. A 33 mM carbonate buffer was used to maintain constant and close to neutral pH (Figure S6). However, after day 150, the swine wastewater was not buffered and pH still remained relatively constant. Dissolved oxygen (DO) of the inflow was also constantly monitored to ensure anaerobic conditions, and the DO measured was consistently below the detection limit (LDO = 0.01 mg/L) of the probe.
Microbial composition analyses
Microbial composition and dynamics of the system were monitored and evaluated by 16S rRNA sequence analysis. The inoculum source and system outflow during batch and continuous modes of operation were surveyed as well as the anode and cathode associated populations for a single reac- tor. This was done to identify the major taxonomic groups enriched within the reactors and to survey the effluents for pathogenic species.
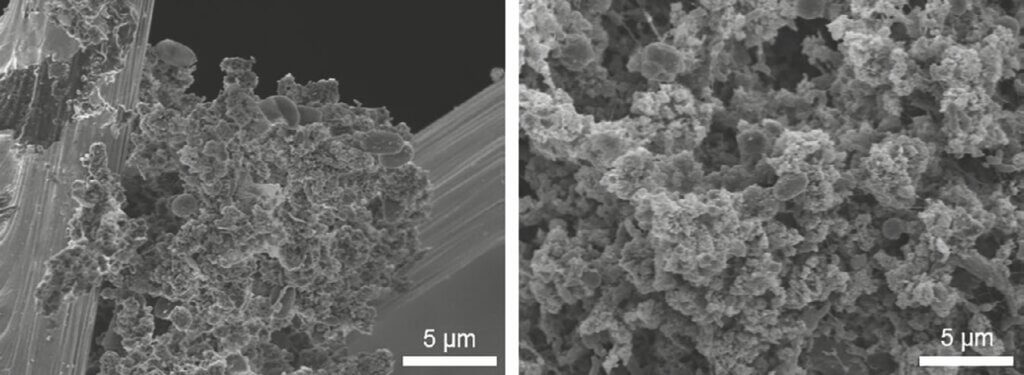
Scanning electron microscopy. The SEM images of the anode and cathode subsamples from reactor 6 confirmed the presence of diverse microbial communities, which was more pronounced on the cathode surface, likely due to the presence of oxygen at the gas diffusion electrodes. Surprisingly, the biofilm on the anode brushes was not uniform and was mainly observed in between fibers of the brushes. It is hypothesized that the surface of graphite brushes is very smooth and hydrophobic, and prevents the formation of strongly attached biofilms. Camera images taken during reactor decommissioning show the presence of thick and uniform biofilm on the brushes, which apparently is lost during sample processing for SEM due to its loose attachment to the graphite fibers (Figure 8a). The cathodic surface was entirely covered with a thick biofilm (Figure 8b). The presence of bacterial appendages in between cells and significant extracellular material can be observed for both anode and cathode biofilms.
Effluent microbial analyses. As seen in Figure 9, the microbial population in the inoculum was mainly determined by the microbial diversity and relative abundance of the stock swine waste solution. Generally, the batch operational condition showed a higher relative abundance of Burkholderiales (an order known to have opportunistic pathogenic species) in the sample effluents and overall lower taxonomic diversity at the order level. The continuous mode of operation revealed higher taxonomic diversity relative to the batch mode (at the order level); however, no significant taxonomic shifts were observed within the most relatively abundant orders until the COD concentration was lowered after day 110.
A high relative abundance of fermentative bacteria from the orders of Bacteroidales and Clostridiales were observed in the inoculum and the system solution at day 0. These two orders occupied nearly 80% of the community. However, after day 4, the relative abundance of Bacteroidales and Clostridiales decreased to roughly 20% and 15% of the total community population, respectively, which remained relatively stable in the effluents throughout 136 days of operation.
Although Desulfuromonadales were not present in detect- able numbers in the inoculum, they became a relatively abun- dant population in the system solution starting at day 58. Most Desulfuromonadales bacteria observed in solution were from the genus of Geobacter and the species identified were associ- ated with Geobacter lovleyi. The abundance of G. lovleyi, 57% from the genus Geobacter, correlates with the DNRA reactions observed in our system at day 58 onwards, as stated previously. After day 1, the relative abundance of fermentative Pseudomonadales significantly increased and remained broadly present until day 28. The beginning of continuous mode showed an impact on the relative abundance of Pseudomonadales, which notably decreased to represent <2% of the overall pop- ulation over the course of continuous operation. Species in the genus Pseudomonas have been reported to degrade com- plex aromatic compounds, a function that may have provided a unique niche for these species during the batch conditions when metabolic products were retained in the system efflu- ent (Jiménez, Miñambres, & García, 2004). The subsequent decrease of Pseudomonadales under continuous mode may be indicative of the COD composition and availability given flow conditions.
Conversely, Campylobacterales appeared in lower relative abundance during batch mode and became one of the more relatively abundant orders during the early stages of continuous mode. Campylobacterales are common inhabitants of gastroin- testinal tracts in ruminant animals as well as humans (Eppinger, Baar, Raddatz, Huson, & Schuster, 2004; Mann & Wozniak, 2012; Virdis et al., 2008). Therefore, the observed increase of relative abundance of Campylobacterales in the effluents during con- tinuous mode may be reflective of the higher loading of these groups into the system. The effluent sample collected on day 135 of the continuous operation shows a relative absence of Campylobacterales. This sample was taken immediately after the COD loading dropped from 1,000 to 500 mg/L, and therefore, the influent may have contained a much lower relative abun- dance of Campylobacterales. Species within Campylobacterales have also been reported to release sulfur and iron into their envi- ronment, promoting growth of bacteria that are dependent on sulfur compounds as substrates for growth and metabolism.
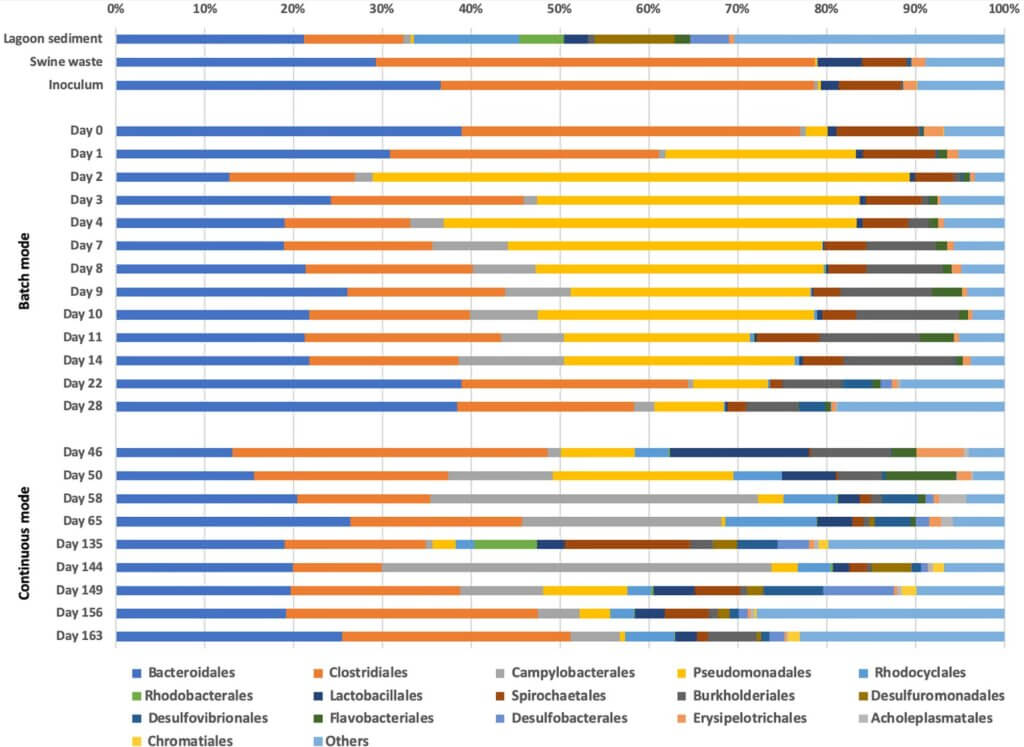
Bacteria from the orders Desulfovibrionales and Desulfobacterales, known as sulfate‐reducing bacteria, were seen in a higher abundance during continuous mode, especially after day 58, coinciding with the increasing abundance of Campylobacterales. The appearance of these sul- fate‐reducing phylotypes in higher relative abundance (espe- cially Desulfobacterales) also correlates well with removal of sulfate from our system observed around the same time.
The microbial population in the effluent samples from all twelve reactors was identical at the order level, consistent with the comparable electrochemical performance of the 12 reac- tors in our system. Further, no significant changes in relative abundance were apparent at the order level when comparing the microbial composition of the inflow wastewater and the outflow composition from each reactor during continuous mode. This data suggests that the microbial population in solu- tion did not massively change, at the order level, by a 4‐hr reten- tion time in the MFC system.
The lack of observed microbial composition differences in the twelve reactors is contrary to the suggestion of Zhuang, Yuan, et al. (2012), Zhuang, Zheng, et al. (2012)), who pro- posed that MFCs hydraulically connected in series would have different microbial composition as a result of the downstream flow of the wastewater. The latter was demonstrated by Chung and Okabe (2009) in a glucose fed MFC system composed of three subsequent units. The main bacterial species present in the three MFCs were different due to the differences in the car- bon substrate available and its concentration in the Chung et al. study. The study reported herein was executed with a signifi- cantly more complex and variable feedstock, and therefore, the differentiation of taxonomic species may not be as prominent or distinguishable at the order level.
While community differentiation in each reactor was not observed in our system effluents, it is possible that a longer hydraulic retention time or additional reactors in the treat- ment train would induce a unique microbial selection. It is also possible that a higher resolution analysis at the genus or species level may provide a deeper insight into unique micro- bial compositions in the twelve reactors. Microbial differen- tiation may also be more apparent in the electrode‐associate communities.
Electrodes microbial population. To evaluate the microbial populations associated with the anodes, cathodes, and residual sludge, we decommissioned a single reactor and extracted samples from the anode and cathode as described earlier. The microbial composition on the anode brushes were nearly identical at the order level in terms of taxonomic diversity and relative abundance indicating adequate water flow and mixing, creating a homogenous environment in the reactors (Figure S7).
The most relatively abundant bacteria at the anode belonged to the orders of Clostridiales and Bacteroidales, which likely contributed fermentative capacity. Desulfovibrionales, Desulfobacteriales, and Desulfuromonadales were all present at the anode surfaces in relatively high abundance. All of these orders are associated with driving sulfur cycling and have also been reported to be involved with electricity production (Ishii, Suzuki, Norden‐Krichmar, Tenney, et al., 2013; Ishii, Suzuki, Norden‐Krichmar, Wu, et al., 2013). The order Rhodocyclales was also present in consistent relative abundance within each anode community. This order has been reported to catalyze a versatile set of biochemical reactions including denitrification (Tharali, Sain, & Osborne, 2016). Because the anodic commu- nities were reproducible across reactors over time and perfor- mance, the stable co‐existence of fermentative and electroactive species in these communities provide strong evidence that elec- troactive enrichments can be selected and maintained from a variety of waste streams for practical applications. It was also observed that the microbial communities at the anode surfaces were distinctly different in composition and relative abun- dance when compared to those characterized from the effluent solution and inflow. This also confirms the stability of biofilm enrichments and associated function in fielded, pilot‐scale microbial fuel cells.
The cathode microbial communities were distinctly dif- ferent in taxonomic composition and relative abundance when compared to the anode and inflow communities. However, the microbial composition of the left and right cathodes, at differ- ent sampling points on the surface, was very similar to each other even though the relative abundances of different orders were apparent. The dominant microbial populations included bacteria from the order Burkholderiales, which features many species that are facultative aerobes, and were present in high relative abundance due to the presence of oxygen at the cathode interface. Burkholderiales are also frequently reported in fresh- water and wastewater systems (Tharali et al., 2016).
Statistical analyses. Canonical correspondence analysis (CCA) was performed on the effluent data collected from the system over time (Figure S3a). The CCA biplot showed that inflow as well as effluent microbial community during batch mode had a higher abundance of Pseudomonadales and Spirochaetales, which disappear over time in continuous mode of operation. It was established that over time reactors were enriched with sulfate reducing/electrogenic (Desulfobacteriales and Desulfuromonadales) and denitrifying bacteria (Rhodocyclales). The Desulfobacteriales and Desulfuromonadales were mainly found at the anode (Figure S3b), and aerobic bacteria from the order Burkholderiales were predominant at the cathode surface due to the presence of oxygen. Burkholderiales have previously been identified in acetate‐amended, denitrifying microbial communities (Ginige, Keller, & Blackall, 2005), showing that denitrification might have occurred at the cathodes. The Burkholderiales order are also one of the most common bacterial orders found in water systems and some species have been reported as opportunistic pathogens.
The samples collected from the anode brushes and the cathodes of reactor 6 were analyzed by PCA (Figure S3b). The samples from the anode brushes were clustered together with a slight taxonomic separation between top and bottom. The bottom of the brushes was populated with more spe- cies from the class Clostridia, which also appeared together with sulfate‐reducing bacteria and electrogenic bacteria (Desulfuromonadales).
A synergistic interaction between Clostridia and sulfate‐ reducing bacteria has been previously reported, and it has been suggested that fermentative bacteria also cooperate with elec- trogenic bacteria in MFCs (Santoro, 2015; Tremblay, 2016). During symbiotic cooperation, the fermentative bacteria break down more complex organic compounds to volatile fatty acids, which are then used by sulfate‐reducing bacteria or electro- genic bacteria such as Geobacter spp.
Conclusions
This study demonstrates the design and operation of a large‐scale MFC system for continuous treatment of swine wastewater at a small farm with an HRT of 4 hr. The sub- set of data presented herein include only 210 days of opera- tion, but the system is still currently running, now for over 2 years. The maximum current density during this time frame was 103 ± 7 mA/m2 (1,011 ± 73 mA/m3) and corresponds to 37 ± 5 mW/m2 (362 ± 52 mW/m3). The normal- ized energy recovery (NER) of the MFC system at 330 Ω was 0.11 kWhr/kg COD, which is higher compared to the NER of anaerobic digestion treatment plant with energy recovery from methane. The maximum COD treatment rate of ~5.0 kg COD/m3 day was observed at day 95, where the COD loading was 2,200 mg/L. The maximum COD removal efficiency (65%) was seen on day 102.
This result reached the goal to achieve a high COD removal rate within a short HRT in a pilot‐scale MFC system. This study moves one‐step closer to applying MFC technology for real, large‐scale wastewater treatment.
Acknowledgments
Funding for this project was provided by a grant from the Roddenberry Foundation. The authors would also like to sin- cerely thank the Escondido Union High School District, San Pasqual High School (SPHS) and the SPHS teachers Arlene Peck and Meghan Garrison as well as our high school interns Kristein Isham, Ryan Moyes, and Anabel Reyes for all of their help and support for onsite operations. We would also like to thank Tei Iki, Doug Gibson, Rick Engineering, Geocon, Precision Concrete, Tom Langpap, Bert Petty, Mark Telfer, Ken Austin and D4C Product Development for their support and efforts toward design and construction of the pilot site.
Data Availability Statement
The data that support the findings of this study are available from the corresponding author upon reasonable request.
References
Chung, K., & Okabe, S. (2009). Continuous power generation and microbial commu- nity structure of the anode biofilms in a three‐stage microbial fuel cell system. Applied Microbiology and Biotechnology, 83(5), 965–977. https://doi.org/10.1007/s00253-009-1990-z
Egbadon, E. O., Akujobi, C. O., Nweke, C. O., Braide, W., Akaluka, C. K., & Adeleye, S. A. (2016). Simultaneous generation of bioelectricity and treatment of swine wastewater in a microbial fuel cell. International Letters of Natural Sciences, 54(May), 100–107. https://doi.org/10.18052/www.scipress.com/ILNS.54.100
Eppinger, M., Baar, C., Raddatz, G., Huson, D. H., & Schuster, S. C. (2004). Comparative analysis of four campylobacterales. Nature Reviews Microbiology, 2(11), 872–885. https://doi.org/10.1038/NRMICRO1024
Ginige, M. P., Keller, J., & Blackall, L. L. (2005). Investigation of an acetate‐fed denitrify- ing microbial community by stable isotope probing, full‐cycle rRNA analysis, and fluorescent in situ hybridization‐microautoradiography. Applied and Environmental Microbiology, 71(12), 8683–8691. https://doi.org/10.1128/AEM.71.12.8683
Hutchinson, A. J., Tokash, J. C., & Logan, B. E. (2011). Analysis of carbon fiber brush load- ing in anodes on startup and performance of microbial fuel cells. Journal of Power Sources, 196(22), 9213–9219. https://doi.org/10.1016/j.jpowsour.2011.07.040
Ichihashi, O., & Hirooka, K. (2012). Removal and recovery of phosphorus as struvite from swine wastewater using microbial fuel cell. Bioresource Technology, 114, 303–307. https://doi.org/10.1016/j.biortech.2012.02.124
Ishii, S., Suzuki, S., Norden‐Krichmar, T. M., Tenney, A., Chain, P. S. G., Scholz, M. B., … Bretschger, O. (2013). A novel metatranscriptomic approach to identify gene expres- sion dynamics during extracellular electron transfer. Nature Communications, 4, 1–10. https://doi.org/10.1038/ncomms2615
Ishii, S., Suzuki, S., Norden‐Krichmar, T. M., Wu, A., Yamanaka, Y., Nealson, K. H., & Bretschger, O. (2013). Identifying the microbial communities and operational con- ditions for optimized wastewater treatment in microbial fuel cells. Water Research, 47(19), 7120–7130. https://doi.org/10.1016/j.watres.2013.07.048
Jiménez, J. I., Miñambres, B., & García, E. D. (2004). Genomic insights in the metabolism of aromatic compounds in pseudomonas. In J. L. Ramos (Ed.), Pseudomonas (pp. 425–462). Boston, MA: Springer.
Kelly, P. T., & He, Z. (2014). Nutrients removal and recovery in bioelectrochemical sys- tems: A review. Bioresource Technology, 153, 351–360. https://doi.org/10.1016/j.biort ech.2013.12.046
Kim, J. R., Dec, J., Bruns, M. A., & Logan, B. E. (2008). Removal of odors from Swine wastewater by using microbial fuel cells. Applied and Environmental Microbiology, 74(8), 2540–2543. https://doi.org/10.1128/AEM.02268-07
Kim, K. Y., Yang, W., Evans, P. J., & Logan, B. E. (2016). Continuous treatment of high strength wastewaters using air‐cathode microbial fuel cells. Bioresource Technology, 221, 96–101. https://doi.org/10.1016/j.biortech.2016.09.031
Lier, J. B., Mahmoud, N., & Zeeman, G. (2008). Anaerobic wastewater treatment. In M. Henze, M. C. M. van Loosdrecht, & G. A. Ekama (Eds.), Biological wastewater treat- ment: Principles, modelling and design (pp. 415–426). London, UK: IWA Publishing.
Lim, S. J., Park, W., Kim, T.‐H., & Shin, I. H. (2012). Swine wastewater treatment using a unique sequence of ion exchange membranes and bioelectrochemical system. Bioresource Technology, 118, 163–169. https://doi.org/10.1016/j.biortech.2012.05.021
Mann, E. E., & Wozniak, D. J. (2012). Pseudomonas biofilm matrix composition and niche biology. FEMS Microbiology Reviews, 36(4), 893–916. https://doi. org/10.1111/j.1574-6976.2011.00322.x
Matlock, M., Thoma, G., Boles, E., Leh, M., Sandefur, H., Bautista, R., & Ulrich, R. (2011). A life cycle analysis of water use in U.S. Pork production. Retrieved from https://www. porkcdn.com/sites/porkorg/library/2011/06/11-133-matlock-uofark.pdf
Mcilroy, S. J., Starnawska, A., Starnawski, P., Saunders, A. M., Nierychlo, M., Nielsen, P. H., & Nielsen, J. L. (2016). Identification of active denitrifiers in full‐scale nutrient removal wastewater treatment systems. Environmental Microbiology, 18(1), 50–64. https://doi. org/10.1111/1462-2920.12614
Min, B., Kim, J., Oh, S., Regan, J. M., & Logan, B. E. (2005). Electricity generation from swine wastewater using microbial fuel cells. Water Research, 39(20), 4961–4968. https
://doi.org/10.1016/j.watres.2005.09.039
Molognoni, D., Puig, S., Balaguer, M. D., Capodaglio, A. G., Callegari, A., & Colprim,
J. (2016). Multiparametric control for enhanced biofilm selection in microbial fuel cells. Journal of Chemical Technology and Biotechnology, 91(6), 1720–1727. https:// doi.org/10.1002/jctb.4760
Parente, S., & Lewis‐Brown, E. (2011). Freshwater use and farm animal welfare.
Sander, E. M., Virdis, B., & Freguia, S. (2015). Dissimilatory nitrate reduction to ammo- nium as an electron sink during cathodic denitrification. RSC Advances, 5(105), 86572–86577. https://doi.org/10.1039/C5RA19241B
Tharali, A. D., Sain, N., & Osborne, W. J. (2016). Microbial fuel cells in bioelectricity production. Frontiers in Life Science, 9(4), 252–266. https://doi.org/10.1080/21553 769.2016.1230787
United States Department of Agriculture (2017). An analysis of energy production costs from anaerobic digestion systems on U.S. livestock production facilities. Technical note #1.
van den Berg, E. M., Boleij, M., Kuenen, J. G., Kleerebezem, R., & van Loosdrecht, M. C.
M. (2016). DNRA and denitrification coexist over a broad range of acetate/N‐NO − ratios, in a chemostat enrichment culture. Frontiers in Microbiology, 7(November), 1842. https://doi.org/10.3389/fmicb.2016.01842
Virdis, B., Rabaey, K., Yuan, Z., & Keller, J. (2008). Microbial fuel cells for simultane- ous carbon and nitrogen removal. Water Research, 42(12), 3013–3024. https://doi. org/10.1016/j.watres.2008.03.017
Zhuang, L., Yuan, Y., Wang, Y., & Zhou, S. (2012). Long‐term evaluation of a 10‐liter ser- pentine‐type microbial fuel cell stack treating brewery wastewater. Bioresource Technology, 123, 406–412. https://doi.org/10.1016/j.biortech.2012.07.038
Zhuang, L., Zheng, Y., Zhou, S., Yuan, Y., Yuan, H., & Chen, Y. (2012). Scalable microbial fuel cell (MFC) stack for continuous real wastewater treatment. Bioresource Technology, 106, 82–88. https://doi.org/10.1016/j.biortech.2011.11.019