
Sofia Babanova 1*, Jason Jones 1, Kelly Wiseman 1, Jaime Soles 1, Jaime Garcia 2, Pedro Huerta 2, Daniel Barocio 2, Ryoji Naito 2, Orlando Arreola 2, Gerardo Garcia 2 and Orianna Bretschger 1
1Aquacycl Inc., Escondido, CA, United States, 2D4C Product Development, San Diego, CA, United States
Edited by: Eileen Hao Yu, Loughborough University, United Kingdom
Reviewed by: Thierry Ribeiro, UniLaSalle, France Osvaldo Frutos, National University of Asunción, Paraguay
*Correspondence: Sofia Babanova sbabanova@aquacycl.com
Specialty section: This article was submitted to Sustainable Process Engineering, a section of the journal Frontiers in Chemical Engineering
Received: 09 December 2021
Accepted: 24 February 2022
Published: 17 May 2022
Citation: Babanova S, Jones J, Wiseman K, Soles J, Garcia J, Huerta P, Barocio D, Naito R, Arreola O, Garcia G and
Bretschger O (2022) Bioelectrochemical Treatment Technology—The New Practical
Approach for Wastewater
Management and GHG Emissions Reduction.
Front. Chem. Eng. 4:832505. doi: 10.3389/fceng.2022.832505
This study presents BioElectrochemical Treatment Technology (BETT) as a new wastewater management solution toward the Net-Zero future. The results reported herein were collected from a BETT pilot system installed at a large brewery in Los Angeles, CA, United States processing 0.6 m3. day-1 of raw brewery wastewater with a high content of fruit pulp. Removal of Chemical Oxygen Demand (COD), Total Suspended Solids (TSS) and protein in mg.L-1 per day or percentage were evaluated over 2 months of continuous operation of the Demo Unit. The GHG emissions associated with the power consumed, biomass produced, and carbon dioxide emitted were estimated and compared to aerobic and anaerobic solutions. It was demonstrated that BETT can process wastewater with higher organic load than most conventional anaerobic systems. The inflow COD loading varied between 48,550 mg/L to 116,200 mg/L, and BETT achieved up to 33% COD removal in 4-h HRT. The TSS removal reached values as high as 79% with incoming TSS concentrations up to 34,000 mg/L TSS. BETT did not directly generate methane and demonstrated 89 and 49% lower landfill methane emissions than aerobic and anaerobic technologies, respectively. The overall reduction in CO2 emissions, both direct and indirect, was estimated to be 85–90% compared to existing practices.
Keywords: Wastewater treatment (WWT), Microbial fuel cells (MFC), pilot scale, carbon dioxide emission reduction, Greenhouse gas (GHG) reduction, Aquacycl
INTRODUCTION
Life on Earth is not possible without access to fresh water. Society requires water for survival, daily routines (shower, cooking, hygiene, cleaning, etc.) and industrial processes (manufacturing, clean in place practices, etc.). No part of modern daily life would be possible without water and all daily activities release wastewater. Wastewater is a valuable resource. However, wastewater requires purification and recovery of useful components to enable water reuse. Many wastewater constituents cannot be released into the environment until properly treated. Thus, the importance of wastewater treatment is two-fold: to restore the water supply and to protect the planet from pollution.
Wastewater management was developed in the 20th century. In 1912 the Eighth Report of the Royal Commission on Sewage Disposal introduced the concept of Biochemical Oxygen Demand (BOD) and established standards and tests to be applied to sewage and sewage effluents which were copied by many other countries (The Eight Report Of The Royal Commission On Sewage Disposal, 1912). Biological wastewater treatment was developed as a concept in 1895 in the form of septic tanks and trickling filters, followed by activated sludge treatment in 1913 (Lofrano and Brown, 2010). The treatment concepts further led to the development of Upward-flow anaerobic sludge blanket (UASB), Membrane biological reactors (MBRs), Sequencing Batch Reactors (SBR) and Moving Bed Biofilm Reactors (MBBRs). Unfortunately, few major advances toward improving wastewater treatment were realized in the 21st century. However, concurrently industrial processes and residential populations continue to grow and produce new, high-strength waste streams that challenge current wastewater practices.
High-Strength Wastewater
Conventional aerobic and anaerobic wastewater treatment technologies are limited in their abilities to remove high concentrations of BOD from wastewater. The main constraint for aerobic systems comes from the limited amount of oxygen that can be dissolved in water (Buchanan and Seabloom, 2004). To maintain efficient treatment conditions in aerobic processes, large quantities of oxygen must be provided and adequately mixed into water. For example if the influent has BOD of 10,000 mg.L−1 then 10,000 mg.L−1 of dissolved oxygen must be provided in order to satisfy the oxygen demand. Regardless of how creative engineers can be, an oxygen supply at that rate is physically impossible.
Anaerobic technologies have a higher capacity for removing BOD in wastewater and can tolerate higher organic loads (Lier et al., 2008; Evren et al., 2011). However, conventional anaerobic processes also face limitations. The higher BOD of the influent can cause the accumulation of Volatile Fatty Acids (VFAs) in anaerobic digesters (ADs). High VFA concentrations in the wastewater can cause a rapid decrease in pH, which has detrimental effects on the anaerobic microbial community and specifically on the methanogenic archaea responsible for biogas production (Franke-Whittle et al., 2014; Moeller and Zehnsdorf, 2016).
Herein we describe a BioElectrochemical Treatment
Technology (BETT®) as an industrial pre-treatment strategy for high-BOD wastewaters. BETT systems are the core product of Aquacycl Inc. (https://www.aquacycl.com) Aquacycl is a for- profit entity providing wastewater treatment solutions to address challenging wastewater problems.
BETT systems are based on Microbial Fuel Cell (MFC) principles (Verstraete and Rabaey, 2006; Du et al., 2007). In BETT systems, like MFCs, the organic matter is oxidized at the anode surface. Electrons, protons and carbon dioxide are released during the oxidation process. Protons travel through the solution from the anode to the cathode in a single chamber reactor. Electrons travel through an external circuit also from the anode to the cathode where they combine with protons and oxygen from air to generate new water or hydrogen peroxide. Thus, BETT converts organic pollutants in wastewater to dissolved carbon dioxide, direct electricity and water or hydrogen peroxide.
BETT by nature is a “hybrid” of anaerobic and aerobic biological degradation of organic matter and electrochemical oxidation and reduction reactions. The organic oxidation at the anode is performed under anaerobic conditions. However, oxygen is required at the cathode to complete the electrochemical reactions in the system. Oxygen is supplied via natural diffusion of air through a gas-diffusion electrode (Bidault et al., 2009), but does not penetrate the bulk solution to create an aerobic environment in the system. Using a gas-diffusion electrode as a cathode facilitates high-rate electrochemical reactions and eliminates the need for dissolving oxygen in water for an aerobic treatment process. This enables the processing wastewater with higher organic loads.
Methanogenesis does not occur in BETT systems and so the technology does not suffer from “toxicity” events because of the accumulation of VFAs. To the contrary, VFAs are a desired intermediate product as they are bio-electrochemically oxidized at the anode surface by specific types of bacteria known as electrogenic bacteria (Logan, 2009; Babanova et al., 2020).
The ideal application for BETT systems are small volumes (0.6—600 m3. day−1) of high-strength wastewater (5,000—150,000 mg.L−1-BOD) or wastewaters that have challenging in compositions organics, for example wastewater from the production, storage and transportation of oil and gas products. Although BETT systems can treat low strength wastewaters (<300 mg.L−1-BOD), they are not economically favorable for these applications when compared to conventional aerobic methods such as membrane bioreactors.
Further, the BOD removal efficiency of BETT systems is significantly reduced when the BOD content in wastewater is less than 150 mg.L−1. Therefore, BETT systems are not considered as a replacement for conventional wastewater treatment technologies, but as a pre-treatment solution to enable downstream technologies to function with less energy consumption, less sludge production, and therefore lower greenhouse gas emissions.
The treatment time in BETT systems varies between 4- and 20-h Hydraulic Retention Times (HRT) under continuous flow conditions. The wide range of time is a function of the composition and/or BOD concentration of the incoming wastewater. Wastewaters with higher BOD and organic solids content will require longer HRTs, such as12-20 h. The same requirement will be applicable for wastewaters with complex or difficult to biodegrade organic compositions. Wastewaters with low BOD and low Total Suspended Solids (TSS) concentrations can be treated in shorter HRTs (4–6 h).
GHG Emissions
All wastewater treatment processes result in the emissions of greenhouse gasses (GHGs) such as carbon dioxide, methane and nitrous oxide (Campos et al., 2016). The majority of the GHG emissions come from the biological degradation of the organic matter, as a result of the energy demand of the treatment and from the degradation of secondary biomass (Mamais et al., 2015). According to the Department for Environment Food and Rural Affairs of United Kingdom, in 2008 the GHG emissions associated with wastewater management were between 3.3 MTCO2e and 4.3 MTCO2e, where 0.2 MTCO2e were a result of the wastewater pumping/collection, 2.1 MTCO2e were generated during the wastewater treatment, and 1–2 MTCO2e came from the landfill application of sludge (Rothausen and Conway, 2011).
Studies have reported that water-related energy use in the US accounts for nearly 5% of total GHG emissions (Rothausen and Conway, 2011)—a figure that is rarely highlighted in climate discussions. However, reduction of greenhouse gas (GHG) emissions throughout the water and wastewater supply chain can be achieved by innovating and optimizing existing practices (Campos et al., 2016).
Aerobic wastewater treatment is extremely energy intensive and generates significant amounts of biomass, carbon dioxide, methane and nitrous oxide emissions (Henze et al., 1995; Campos et al., 2016) with only 1% of the incoming BOD being emitted as methane (Campos et al., 2016). The primary contributor to GHG gases in aerobic technologies is their direct emissions during the treatment process with nitrous oxide being the highest contributor (Mamais et al., 2015; Campos et al., 2016).
The second large contributor to GHG emissions in aerobic treatment is the energy usage. The high energy demand of activated sludge systems typically comes from the requirement of forcing air into water to catalyze the biological consumption of organics. Aeration processes account for 50–60% of the electricity consumption of a given activated sludge plant (Mamais et al., 2015; Chen et al., 2018). Up to 3% of the total US electricity consumption comes from aerobic wastewater treatment plants (McCarty et al., 2011).
Methane and carbon dioxide are emitted when anaerobic digestors are used for wastewater treatment. Biogas generated from ADs can be captured, purified, and sent into a natural gas line or combusted to generate electricity and heat. The latter makes ADs a “cleaner” solution to the GHG problem (Bracmort, 2010; Zaks et al., 2011). Unfortunately, the combustion devices are expensive and inefficient, with the efficiency of the cogeneration processes only reaching 30% (Bracmort, 2010).
In addition to the lower conversion efficiency of methane to electricity, a significant loss of dissolved methane in the effluents was reported as a main contributor of GHG emissions for conventional anaerobic systems (Chen et al., 2018). If methane is not effectively harnessed, or facultative lagoons are used for treatment, carbon dioxide and methane are directly released in the atmosphere contributing to the greenhouse effect.
In BETT processes the anaerobic biological degradation of the organic contaminants does not result in methane generation, and significant reduction in carbon dioxide emissions is realized when compared to current wastewater management practices.
BETT systems consume significantly less power compared to conventional treatment technologies. Low power consumption is due to three major features: i) Passive air supply through the gas- diffusion cathode (no energy input for aeration); ii) Gravity flow and the use of equipment with very low power demands; and iii) BETT generates direct electricity during the treatment process, which can be used to offset the power demand of the system.
The power consumed for the treatment of 1 kg-BOD with BETT systems ranged between 0.1 and 0.2 kWh.kg-BOD−1 (estimated in this study) compared to 0.5–0.7 kWh.kg-BOD−1 for anaerobic digestors and 2.2–6.2 kWh.kg-BOD−1 for aerobic treatment (USDA, 2007; Haas et al., 2018).
The anaerobic conditions and the controlled manner of the oxidation process at the anode in BETT reactors also adds to the benefit of less secondary biomass generation (He et al., 2017). The amount of secondary biomass produced from BETT systems is 5.1% from the BOD removed versus 10% from ADs and 45% from aerobic technologies (Henze et al., 1995). Therefore, BETT contribution to landfill methane emissions is significantly lower than anerobic and anaerobic technologies.
The advantages of a microbial fuel cell approach to wastewater treatment, relative to conventional technologies, are very well described by Gude in his 2016 review (Gude, 2016). Trapero et al. (Trapero et al., 2017) also give some insights into the economic value of MFCs in wastewater treatment and their path to commercialization.
BETT Demonstrations to Date
BETT systems were described and evaluated in previous pilot scale demonstrations (Babanova et al., 2019, 2020; Babanova, 2020). The first BETT pilot was installed in 2015 for the treatment of swine wastewater at a small farm (Babanova et al., 2019). This pilot demonstrated the unique design of BETT systems, the inoculation strategy and principle of BETT operation. The study focused on influent and effluent composition, conversion principles and treatment rates. The microbial composition of the anodic and cathodic microbial populations was also investigated in detail.
The article entitled “New perspectives in sugar industry wastewater treatment” published in International Sugar Journal in 2020 (Babanova, 2020) describes a case study of BETT system treating wastewater from a confectionary plant. The focus on this study was to demonstrate the feasibility of BETT for the treatment of wastewater with extremely high organic content. The Chemical Oxygen Demand (COD) of sugarwater treated was in the range of 100,000–300,000 mg.L−1. The biomass generated from BETT pilot was established to be only 0.03–2.5% of the COD removed. The total biomass generated from BETT ranged between 4 and 112 mg.L−1 as Volatile Suspended Solids (VSS). The same COD removal realized from anaerobic digestion is anticipated to result in 381 to 4,615 mg.L−1 VSS. Aerobic treatment would result in 1,522 to 18,462 mg.L−1 VSS (assuming identical COD loading in all cases).
The 2020 study described in Water Environment and Technology focused on the applicability of BETT systems as an industrial pre-treatment step to anaerobic digestion (Babanova et al., 2020). Using BETT to normalize the AD feedstocks can increase biogas production and treatment efficiencies for the AD. BETT reduces the COD load to the AD, enriches the wastewater with VFA, reduces the variability in feedstock concentration and composition, and reduces or eliminates the effect of nitrate and nitrite as competing reactions in ADs.
This current study further demonstrates the ability of BETT systems to treat high-COD wastewaters. The BETT Demonstration Unit (Demo Unit) was installed at a large brewery in Los Angeles, CA, and processed 0.6 m3. day−1 of brewery wastewater. The brewery wastewater was characterized with high organic (COD of 50,000–100,000 mg.L−1), protein (>4,000 mg.L−1) and solids content (TSS > 10,000 mg.L−1), which makes this specific waste stream impossible for aerobic treatment and very challenging for ADs due to the solids content.
In addition, GHG emissions associated with operations of the BETT system were evaluated to characterize the carbon footprint and compare against existing wastewater management practices. GHG emissions are rarely considered or reported when wastewater treatment solutions are discussed. The GHG emissions associated with the power consumed, biomass produced, and carbon dioxide emitted by BETT units were estimated and compared to aerobic and anaerobic solutions.
MATERIALS AND METHODS
BETT Reactor Design
Each BETT reactor was composed of plastic body, anode assembly, cathodes, and cathode holders (Supplementary Figure S1). BETT reactor design was developed by Aquacycl and is covered by non-provisional patent US D875,207.
The plastic body had a rectangular shape with internal dimensions: 25 cm × 19 cm × 16.5 cm, and volume of 7.9 L with an inflow and outflow openings. BETT reactor body was manufactured by injection molding technique using ABS plastic material. The reactor body manufacturing was done by a subcontractor in South Korea and the final reactor assembly was performed at Aquacycl.
The anode assembly had twenty-eight anode units electrically connected in series. Each anode unit had branched electrode structural design in which conductive textile material (Zoltek PW06), having high surface area that provides improved microbial adhesion, was configured around a conductive core. Carbon textile material 15 cm in height and 2.5 cm in diameter was used for microbial adhesion surfaces and Ti-wire (Grade 2 polished titanium wire, diameter 1 mm) was used for the stem. The anode unit design and configuration were also developed and patented by Aquacycl (US2020036029A1). The manufacturing of the anode units was done by a subcontractor in Mexico.
Two gas-diffusion cathodes (19 cm × 28 cm, geometric surface area 532 cm2) were placed on both sides of the reactor and connected in series. The material composition and design of the gas-diffusion cathodes is an Aquacycl trade secret. The cathodes were manufactured at Aquacycl facility in Escondido, CA, United States.
Demonstration Unit Design
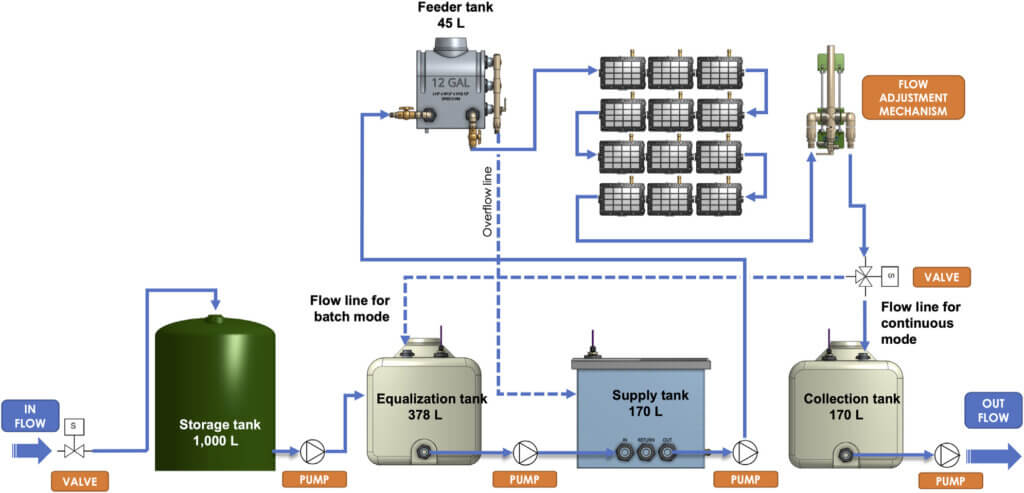
The Demo Unit used in this study was a skid-mounted, automated pilot unit, designed to continuously process 0.6 m3. day−1 of wastewater. The Demo Unit was equipped with equalization, supply, feeder and collection tanks, and twelve BETT reactors connected in hydraulic series with a consecutive flow of the wastewater from Reactor 1 to Reactor 12 (Figure 1; Supplementary Figure S2). The overall volume of the system was 350 L.
The untreated brewery wastewater was first collected into a storage tank. Sodium bicarbonate was added to the storage tank to improve conductivity and increase pH of the wastewater. The wastewater was then fed into the equalization tank of the Demo Unit. Further pH adjustment was performed in the supply tank using 10 M sodium hydroxide. Bluelab pH controller was used for automatic pH adjustment in the supply tank.
The waste stream was transferred to the elevated feeder tank and gravity-fed into the reactors A peristaltic pump was used to control the outflow rate. Treated effluents from the system were collected in the collection tank and discharged to sanitary sewer. The hydraulics operation of the Demo Unit was fully automated and controlled by Programmable Logic Controller (PLC) and remotely monitored and controlled via Web User Interface. BETT reactor operation and evaluation was executed by specifically designed firmware able to switch resistors, measure voltage and perform polarization measurements.
Demo Unit Inoculation and Operation
The Demo Unit was installed and operated at brewery facility located in Los Angeles, California and used to continuously process 0.6 m3. day−1 of brewery wastewater with high COD and TSS content. The Demo Unit was inoculated and enriched for 1 month and operated under continuous mode for an additional 2 months. The system was fully exposed to the environment.
Demo Unit Inoculation
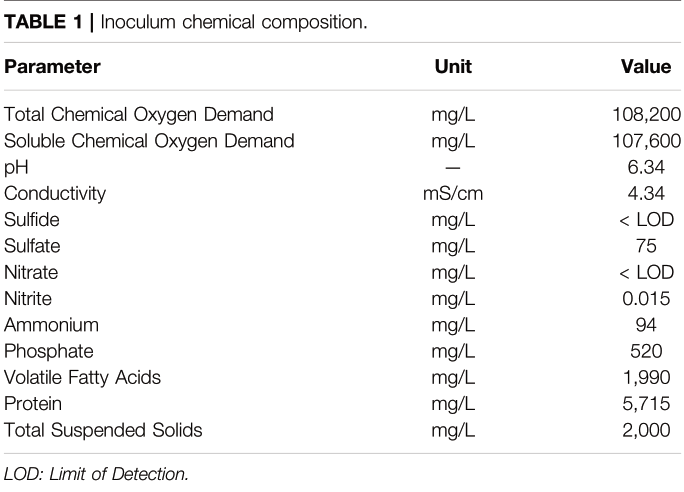
The system was inoculated with brewery wastewater, anaerobic activated sludge and lagoon sediment. The chemical composition of the brewery wastewater used for inoculation is shown in Table 1.
The system was first filled with 200 L of brewery wastewater. The pH of the wastewater was adjusted to 6.34 with 10 M NaOH. Anaerobic activated sludge (19 L) and lagoon sediment (0.6 L) separately mixed in distilled water were introduced into the feeder tank.
Demo Unit Operation
For the first 30 days, the system was operated in a batch mode with recirculation of the inoculum solution through the equalization tank and BETT reactors at a flow rate of 0.38 L. min−1. The anode and the cathode of each reactor were initially connected to 47,000 Ω resistor. The resistor magnitude was subsequently lowered to 4,000 Ωat day 8; 1,143 Ω at day 15 and 400 Ω at day 21.
After 30 days, the operation was switched from batch to continuous flow mode. For the duration of the continuous mode the resistor was predominantly 400 Ω and was lowered to 200 Ω at day 85 and 114 Ω at day 86.
TABLE 1 | Inoculum chemical composition.
Electrochemical Characterization
The voltage (V) across an external resistor for each reactor was monitored in 30 min intervals using specifically designed automated measurement system. The reactors were periodically disconnected to measure open circuit potential (OCP) of the electrodes and perform polarization measurements.
Polarization measurements were carried out by varying the external resistance from open circuit to 8 Ω in 5 min intervals. The voltage of the reactor as well as the electrodes potentials were measured with each resistor applied. Current (I) and power (P) were calculated using Ohm’s law (I = V/R and P=V*I).
The current and power densities of each individual reactor were calculated as the current of the reactor normalized to the cathodes geometric surface area (0.1604 m2).
Sampling and Chemical Analyses
The Demo Unit was equipped with two sampling ports, for sampling the inflow and outflow of the system. The inflow sampling port was positioned on the feeder box before the wastewater entered BETT reactors. Note that the wastewater had been pH adjusted at that point. The outflow sampling port was positioned after the BETT reactors before the treated wastewater was collected into the collection tank and discharged into sewer. Samples were collected manually, transported under ice and tested at Aquacycl lab facility. Periodically samples were analyzed at an EPA certified lab (Enviromatrix Analytical Inc., San Diego, CA, United States).
During the enrichment phase when the system was operated under batch mode, samples were collected periodically from the inflow sampling port. During continuous mode of operation, samples were collected from the inflow sampling port and 4 h later (representing total hydraulic retention time, HRT, in the system), from the outflow sampling port as representative for influent and effluent samples. Samples were collected at least once a week during continuous mode.
Chemical Oxygen Demand (COD) of influent and effluent samples were periodically analyzed using Hach DR850 and DR900 instruments following Hach Method 8,000. Total Suspended Solids (TSS) was quantified using EPA method 160.2. Protein concentration was measured using. Pierce™ BCA Protein Assay Kit according to Thermo Scientific Method 23225. Volatile Fatty Acids were analyzed with Hach Volatile Acids TNTplus Vial Test (50–2,500 mg/L) as acetate and Hach Method 10240. Phosphate was determined with Hach PhosVer® 3 Phosphate Reagent Powder Pillows and Hach Method 8,048. pH and conductivity were measured with Hach HQ40D Portable Multi Meter and IntelliCAL PHC201 Laboratory General Purposes Gel Filled pH Electrode and IntelliCAL CDC401 Laboratory 4-Poles Graphite Conductivity Cell, respectively.
Biological Oxygen Demand (BOD), sulfate, sulfide, nitrite, nitrate and Volatile Suspended Solids (VSS) analyses were outsourced to an EPA certified lab (Enviromatrix Analytical Inc., San Diego, CA, United States).
COD removal rate, COD removal efficiency, TSS removal efficiency TSS loading and biomass produced were calculated as indicated in Supplemental Material.
GHG Emissions Calculations
The estimation of GHG emissions of BETT Demo Unit was performed following the methodologies established by the US Environmental Protection Agency (RTI International, 2010). For comparison, the GHG emissions released by aerobic and anaerobic treatment practices treating the same BOD load as BETT system were calculated using the same methodologies. Some assumptions were considered, such as: the power consumed by aerobic treatment varies between 2.2 and 6.2 kWh per kg-BOD removed (Haas et al., 2018); the power consumption of anaerobic technologies is in the range of 0.5–0.7 kWh.kg-BOD−1 removed (USDA, 2007; Lier et al., 2008). The power consumption of BETT system was measured as 0.1–0.2 kWh-kg-BOD−1 removed depending on the season, where the power consumption is higher during the winter and lower during the summer months. The COD removed was assumed as 24,800 mg.L−1, which was the maximum removal established for BETT Demo Unit in this study.
The biomass produced as a function of the BOD removed was assumed to be 45 and 10% for aerobic and anaerobic techniques, respectively (Henze et al., 1995). The biomass produced by BETT Demo Unit was determined to be 5.1% from BOD removed, sludge recovered, and protein content of secondary sludge.
RESULTS AND DISCUSSION
The treatment capacity and energy recovery capabilities of the BETT system was strongly dependent on the mode of operation, e.g., batch versus continuous mode. The data collected during batch and continuous modes were evaluated and compared separately.
During batch mode the wastewater was cycled through the system and periodically refreshed. This mode was important during the enrichment phase as it did not allow for flushing out the bacteria. Unfortunately, during batch mode accumulation of metabolic compounds can be observed, which can slow down the degradation process due to product inhibition. To avoid product inhibition, continuous mode was the preferred mode of operation of BETT systems.
Under continuous mode, fresh wastewater was constantly flowing through the system at 380 ml.min−1. It has been established by other research that during continuous mode the microbial community structure is uniquely organized because of the different environment in each MFC resulting from sequential passing of products between MFCs in series (Chung and Okabe, 2009).
The natural selection of specific bacteria for the given wastewater composition and degradation processes in each individual MFC within a series enhances the efficiency of the overall MFC treatment train.
Batch Mode (Enrichment Phase)
Batch mode was predominantly used during the enrichment phase when the major goal was the development of stable anodic biofilm. Thus, during batch mode the wastewater was recycled through the system for 15 days and partially refreshed at day 15 and day 21.
The COD removal rates during batch mode were estimated in mg.L−1 per day and as percentage removal. A batch cycle was also induced when the wastewater was refreshed and/or when the resistor was changed.
COD and VFA Profiles
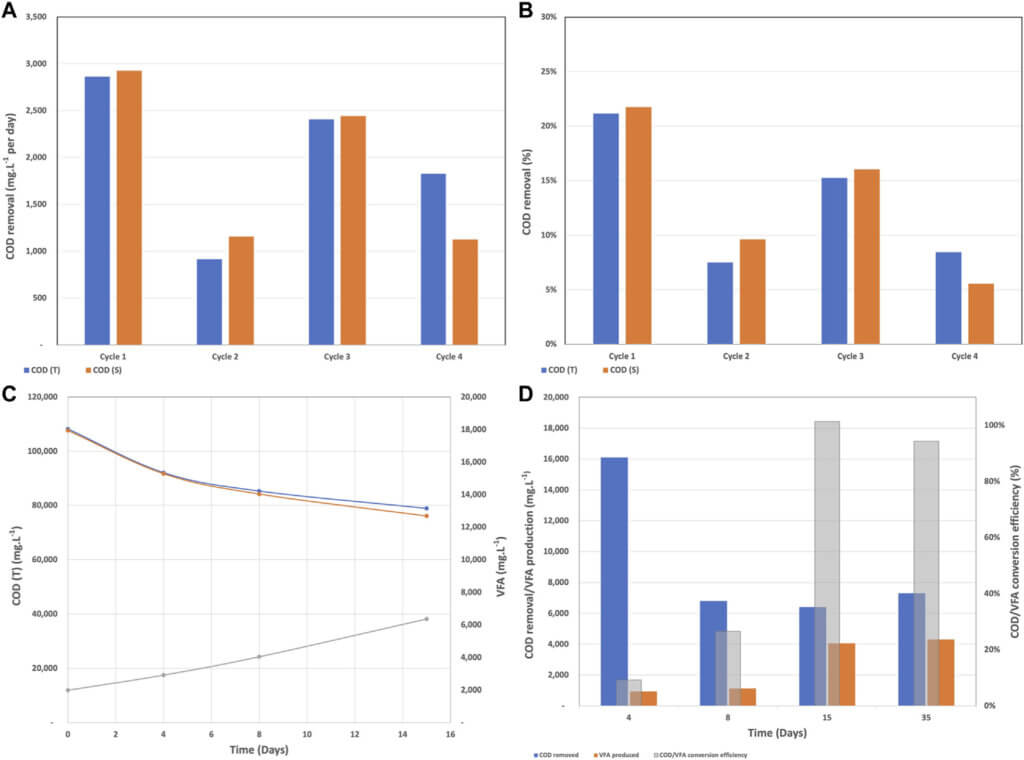
The COD removal rate during batch mode fluctuated between 914 mg.L−1. day−1 and 2,925 mg.L−1. day−1 and between 6 and 22% as shown in Figures 2A,B. Cycles 1 and 2 had the same wastewater and the resistor was changed form 40,000 Ω to 4,000 Ω at the beginning of cycle 2. Due to the accumulation of secondary metabolites and therefore reduced biological activity, the COD removal rates during cycle 2 were lower. The wastewater was partially refreshed at the beginning of cycles 3 and 4 along with a resistor change to 1,114 and 400 Ω for cycle 3 and 4, respectively. Partially removing the secondary metabolites by refreshing the wastewater was the reason for the higher removal rates during cycle 3. Unfortunately, the partial replenishment was not able to completely remove the inhibitory effect of metabolites and the removal rates remained in the low range.
As we mentioned before in BETT reactors, the complex organics present in the wastewater are transformed into VFAs, which are subsequently oxidized to carbon dioxide, electrons, and protons at the anode surface. Hence, it is expected that the amount of COD will decrease and the concentration of VFA will increase over time. The described trend can be seen in Figure 2C, where for day 15 the COD decreased from 108,200 mg.L−1 to 78,900 mg.L−1 and the VFA concentration increased from 1,990 mg.L−1 to 6,363 mg.L−1. Figure 2C also confirmed the statement that the accumulation of metabolites slows down the treatment. The COD removal was higher for the first 4 days of the cycle (16,100 mg.L−1 COD removed) and decreased to 6,400 mg.L−1 COD removed for the last 7 days.
As the anodic biofilm developed and the microbial community acclimated to the brewery wastewater and the anode as a sole electron acceptor, the COD/VFA conversion efficiency reached 100% after day 15 and remained high for the rest of the batch mode (Figure 2D). The high conversion efficiency was an indication of successful fermentation and the reduction of COD over time confirmed the bio-electrochemical oxidation at the anode surface.
Electrochemical Characteristics
Periodically, the reactors were disconnected for 1 h and the Open Circuit Potential (OCP) of the anode and the two cathodes were measured versus Ag/AgCl reference electrode. Figure 3 shows the average OCPs of the anode, left and right cathodes. The average and standard deviation were calculated from the measurements of the twelve BETT reactors.
The electrodes followed the same trend across the twelve BETT reactors, where the cathodic potential decreased rapidly during the first 15 days and remained relatively constant for the rest of the batch mode. The decrease in the cathodic potential may be associated with biofouling of the cathode surface due to the growth of bacteria facilitated by the presence of oxygen (Erable et al., 2012). The high protein content of the wastewater may also have significantly decreased the cathodic potential. Protein molecules are generally hydrophobic and as such can penetrate the hydrophobic pores of the gas-diffusion cathodes and reduce the oxygen transport across the cathode. The reduced oxygen concentration causes decreased cathodic potential similar to biofouling. The brewery wastewater used in this study had high protein content, which for the duration of the batch mode was consistently exceeding 3,000 mg/L (Supplementary Figure S3).
The anode was fully developed over the first 15 days as evident by the anodic OCP reaching -527mV vs. Ag/AgCl (Supplementary Figure S4) for all reactors. It was established that the anodic potential is very sensitive to pH fluctuations with the anodic potential becoming more negative at more neutral pH. Neutral pH values are expected as the optimal pH for microbial communities in MFCs (He et al., 2008).
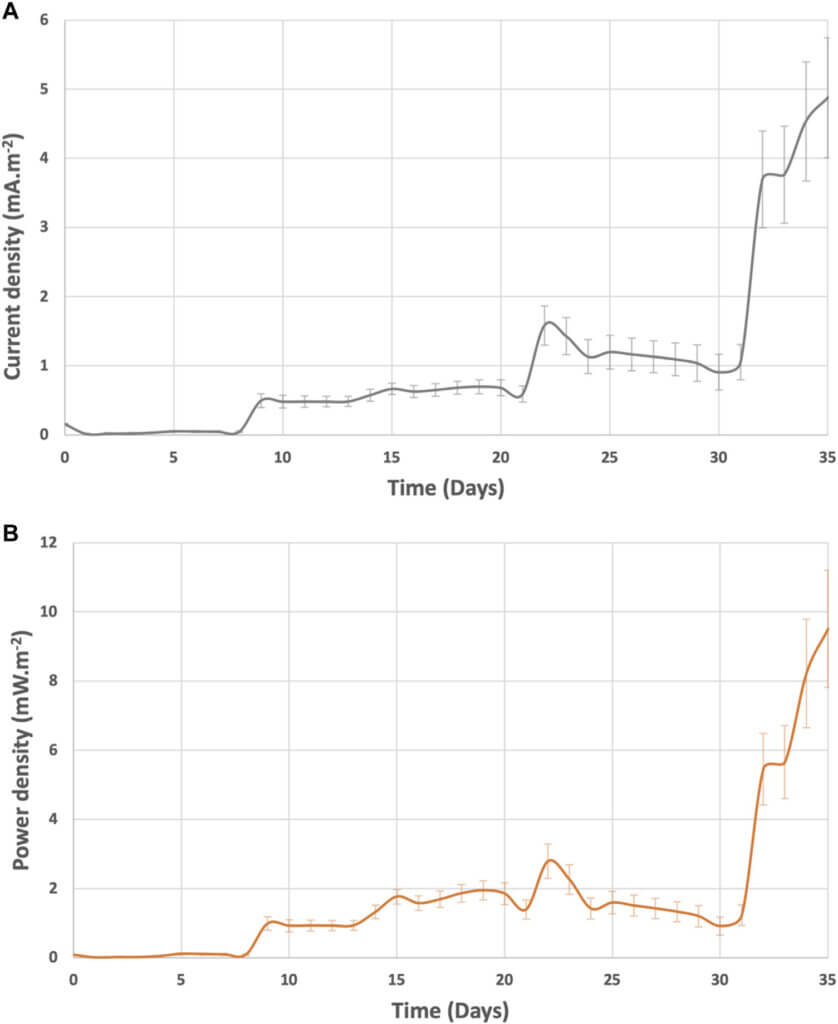
The daily average current and power densities generated from a single BETT reactor during batch mode are represented in Supplementary Figure S5. The maximum current and power densities per BETT reactor reached 4.8 ± 0.9 mA m−2 and 9.5 ± 1.7 mW m−2, respectively. Thus, the cumulative current density from the Demo Unit would be 63 mA m−2 and 114 mW m−2.
The current and power densities were higher than those recorded by Zhuang at al. treating brewery wastewater with a stack of MFCs (Zhuang et al., 2012). The higher current and power observed with BETT system can be due to the higher organic load for BETT compared to Zhuang (2,120 mg.L−1 COD). Feng at al. demonstrated a linear dependence of the generated power from the solution conductivity and Monod dependence of the latter from the substrate concentration (Feng et al., 2008).
Both, the current and power densities followed the same trend of increasing over time as a result of the decreasing resistor load (Figure 4). In general, the voltage generated from each BETT reactor was higher along the hydraulic treatment train with reactor 12 showing a higher voltage than reactor 1 (Supplementary Figure S5). This is expected given the hypothesis that hydrolysis and fermentation are predominant in the first reactors and the conversion of VFAs to carbon dioxide is carried out mainly within the later subsequent reactors i.e. towards the end of the hydraulic series.
Continuous Mode
On day 35 the system was switched to continuous mode of operation with a constant supply of brewery wastewater and a continuous discharge of the BETT-treated wastewater. The HRT through the twelve BETT reactors was 4 h under continuous flow. Given the short HRT, the small number of reactors in hydraulic series and the high COD concentration of the wastewater, the Demo Unit was targeting a COD removal of 10–15% relative to incoming concentrations.
COD and VFA Profiles
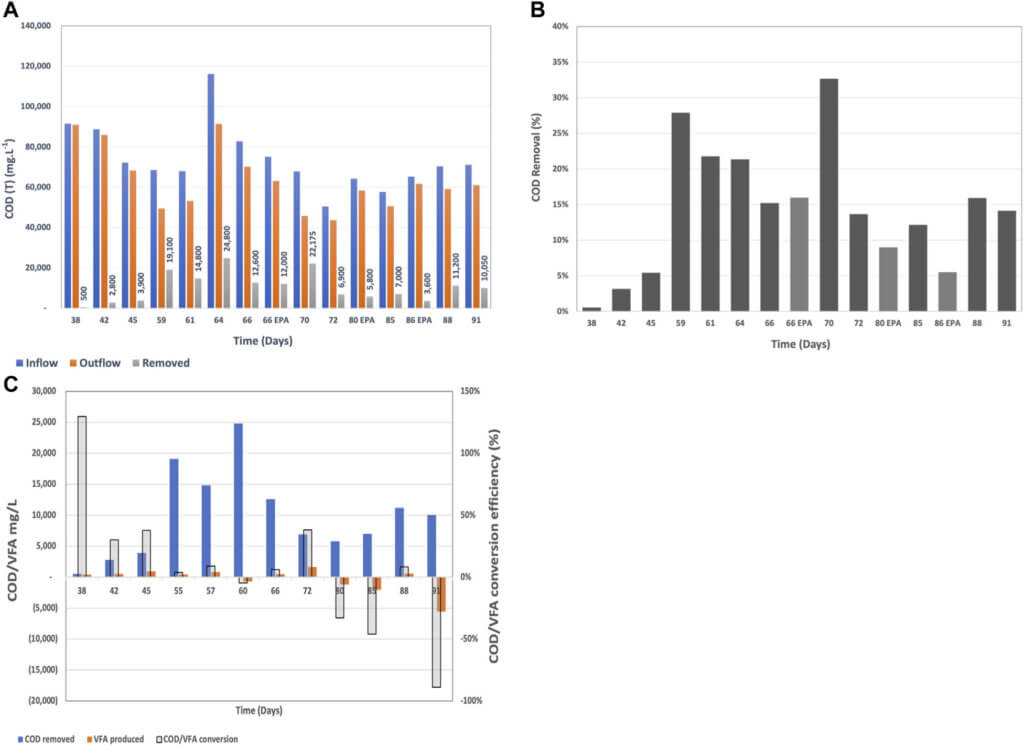
The system required a week to acclimate to the continuous mode, which was reflected by the low COD removal rates until day 45. Once the system was acclimated to the new mode of operation, the COD removal rates were on average 17 ± 8%, which was higher than the targeted COD removal range. The inflow COD concentration varied between 48,550 mg.L−1 and 116,200 mg.L−1 depending on the brewing status at the given time. The COD removal varied between 3,600 mg.L−1 and 24,800 mg.L−1 over the 4 h of residence time and was dependent on the starting COD concentration, pH, temperature and flow rate. Higher inflow COD and neutral pH were associated with higher removal rates. This confirms subsequent studies showing that COD removal (in mg.L−1) is a
function of the incoming COD where higher incoming COD usually induces higher removal rates (Babanova et al., 2019).
The majority of studies involving MFCs for the treatment of brewery wastewater report inflow COD values around 2,000 mg.L−1 (Feng et al., 2008; Wang et al., 2008; Zhuang et al., 2012; Dong et al., 2015), which is significantly lower than the COD reported in this study. The highest COD removed from a stack of MFCs under continuous mode treating brewery wastewater was reported to be 989 mg.L−1 at a starting inflow concentration of 1,501 mg.L−1 (Sun et al., 2010). To our knowledge, there is no AD that can treat brewery wastewater with COD consistently higher than 45,000 mg.L−1 and VFA above 1900 mg.L−1.
The COD to VFA conversion relationship showed a different trend compared to batch mode (Figure 8). At the beginning of the continuous mode when the system was still acclimating to the new mode of operation, the COD to VFA conversion efficiency was higher due to the low subsequent oxidation of VFAs to carbon dioxide at the anode surfaces. Thus, VFAs remained in the system and the COD/VFA conversion efficiency appeared higher. Later on, when the VFA removal rates increased due to the accelerated consumption of VFAs at the anode surface, the COD/VFA conversion efficiency appeared as negative. The latter, is a confirmation of the hypothesis that under continuous mode with multiple MFCs connected in hydraulic series, different processes will predominate throught the different reactors within the hydraulic series. Hydrolysis and fermentation will be the dominant processes at the beginning of the reactor series and bioelectrochemical oxidation of VFAs will prevale towards the end of the hydraulic series. This phenomenon has been observed in another Demo Unit also treating brewery wastewater (Babanova et al., 2020).
Protein and TSS Removal
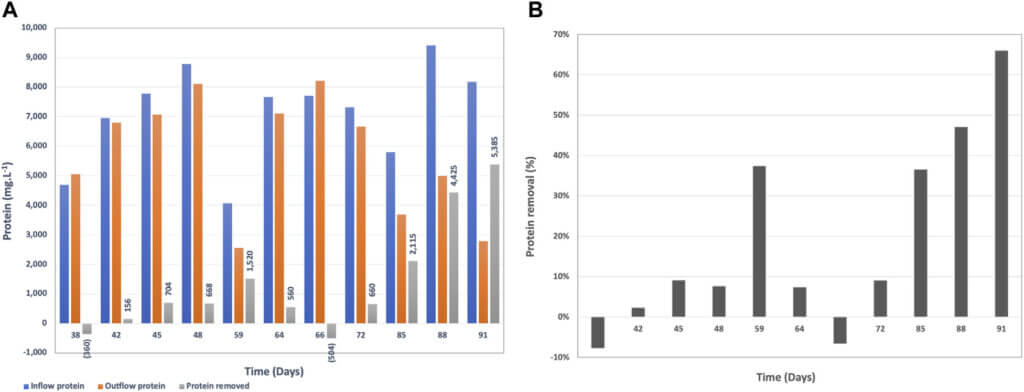
The brewery wastewater in this study contains the centrifugate from the yeast separation after the brewing process. Therefore, it is characterized with high protein content mainly from yeast (Figure 5A). This protein is very challenging to break down since it is already a part of the cell structure of yeast. The lowest protein concentration in the inflow wastewater was 4,072 mg.L−1 and the highest measured was 9,410 mg.L−1.
The protein removal rate by BETT was in the range of −8–66%, where the negative protein removal was due to biomass growth at the beginning of the continuous mode during the acclimation phase. Removals reached sufficient rates (36–66%) later in the continuous mode (Figure 5B).
The high protein concentrations contributed to the reduction of the cathodic performance as indicated by the cathodic OCPs (Supplementary Figure S4). A possible solution is to use solids separation or centrifugation prior to wastewater treatment with BETT system. The spent yeast can be used as a feedstock for various industrial applications (Mussatto, 2014). This pre- treatment step can also reduce the amount of solids entering the treatment system.
Total Suspended Solids (TSS) is a regulated parameter for wastewater discharge into sewer, and industries are often facing fees associated with high TSS of the discharged wastewater (United States Environmental Protection Agency, 1992). Therefore, TSS removal is an important parameter in wastewater treatment.
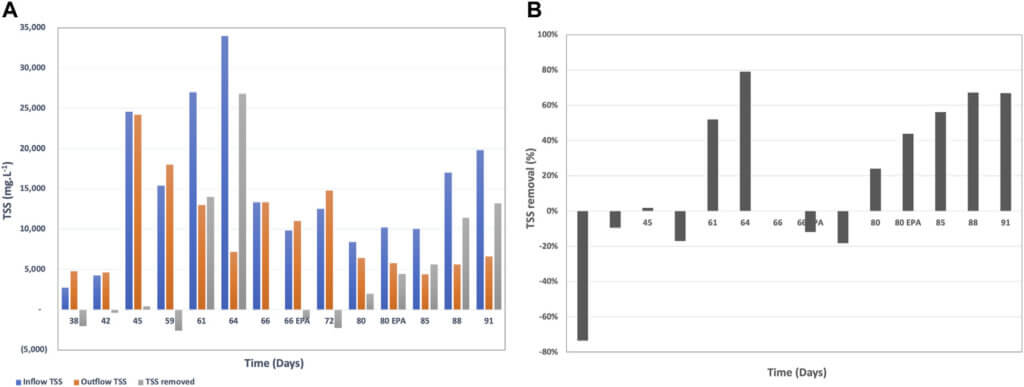
When the TSS is mostly organic, it can be biologically consumed during the treatment process. BETT Demo Unit demonstrated sufficient TSS removal rates after day 72 of system operation (Figure 6). TSS removal rates reached up to 26,800 mg.L−1 in 4 h HRT, which corresponded to 79% removal. It has to be noted that the incoming TSS was for the most part higher than 10,000 mg.L−1 and in some cases was in the range of 20,000 mg.L−1 to 34,000 mg.L−1 TSS. The high TSS removal rate is partially due to the settling of solids inside the reactors. The solids degradation is usually a slower process compared to the degradation of soluble organics. The accumulated solids ultimately break down but the solids residence time is sufficiently longer than soluble COD.
Electrochemical Characteristics
As noted earlier, the protein molecules can penetrate the hydrophobic channels of the gas-diffusion layer of the cathodes and thus decrease the oxygen supply to the cathode surfaces. The lack of sufficient oxygen at the water-cathode interface allowed for other reduction reactions to take place (sulfate reduction, nitrate reduction, nitrite reduction, etc.), which led to reduced cathodic potential over time (Supplementary Figure S4). The cathodic potential was initially reduced during the first 2 weeks of batch mode to approximately -100 mV vs. Ag/AgCl and remained relatively stable until day 60. After day 60, the cathodic potential drastically decreased to—316 mV and -313 mV vs. Ag/AgCl for left and right cathodes, respectively. An interesting observation is that the reduction in the cathodic potential correlates with the shift of the anodic potential towards more negative values i.e., more active anode. The authors hypothesize that the accelerated anodic reaction requires faster cathodic reaction that cannot be provided by oxygen reduction reaction (ORR) due to the limited oxygen supply. Thus, the accelerated anodic reaction drives the parasitic reactions at the cathode to a higher rate, which defined the cathodic potential. The same observation was established with other wastewaters in BETT systems (data not included).
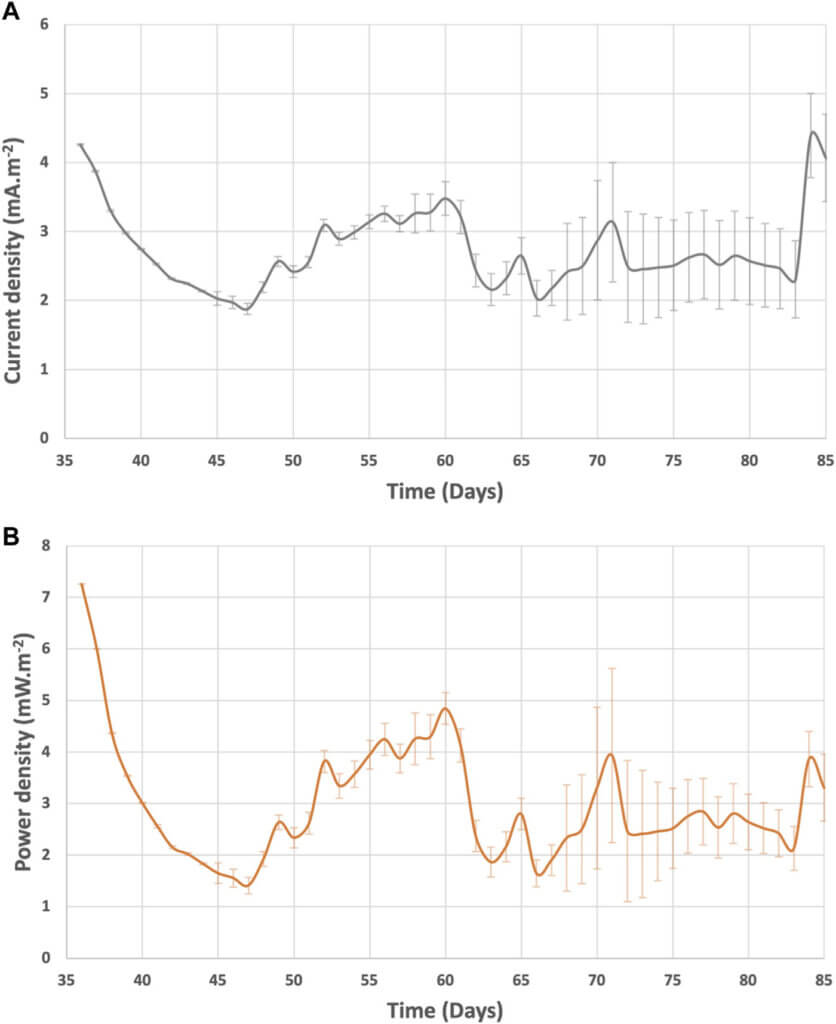
The system current and power generation were in the range of 1.9—5.7 mA m−2 and 1.4—9.5 mW m−2 (Figure 7). After day 60, the current and power of BETT Demo Unit were on average 2.9 ± 0.9 mA m−2 and 2.8 ± 0.7 mW m−2. Compared to previous BETT Demo Unit treating swine wastewater (current generated was around 2 0 mA m−2 during continuous mode (Babanova et al., 2019), the current and power generated under this study were lower most likely due to the lower cathodic potentials and the interference of parasitic cathodic reactions. Swine wastewater has significantly lower protein content than brewery wastewater, which further confirms the hypothesis.
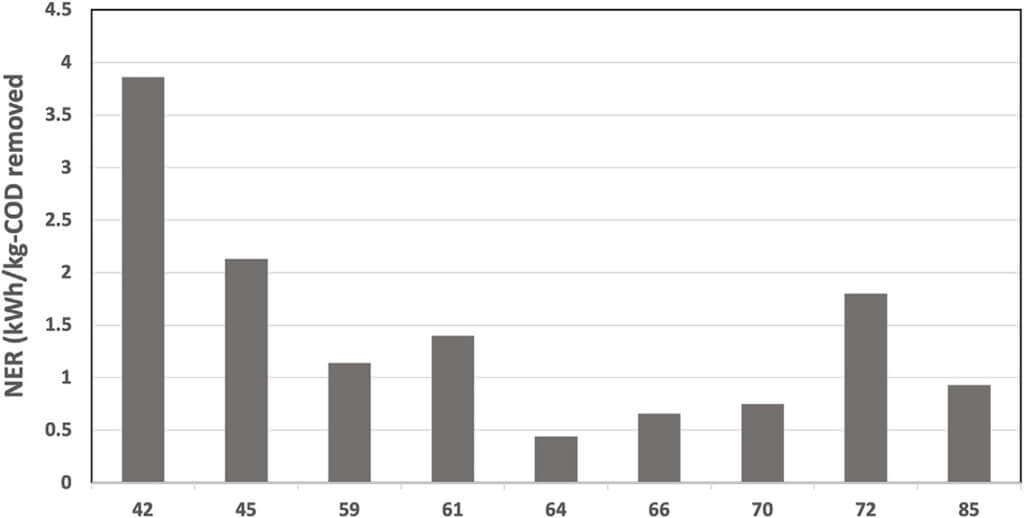
As expected, the Net Energy Recovery (NER) was higher at the beginning of the continuous mode and was reduced after day 60 due to the decreased cathodic reaction (Figure 8). The NER was significantly higher than previously reported data for 12-MFC unit pilot installation treating swine wastewater (0.11 kWh.kg- COD−1) (Babanova et al., 2019) and BETT Demo Unit for brewery wastewater treatment (0.14 kWh.kg-COD−1) (Babanova et al., 2020), The NER in this study was comparable to identical Demo Unit deployed at a confectionary facility (1.6 kWh.kg-COD−1) processing sugarwater (Babanova, 2020). The reduction in the generated current and power did not have a detrimental effect on treatment rates.
GHG Emissions
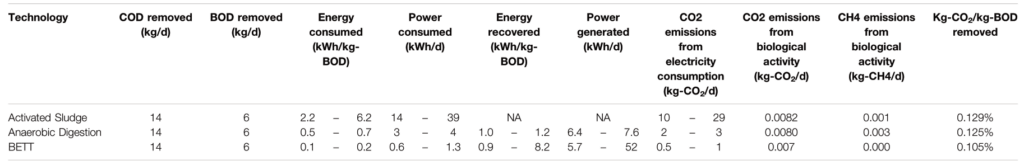
The direct CO2 and CH4 emissions from biological activity, and indirect CO2 emissions from electricity consumption and landfill CH4 emissions for BETT Demo Unit were estimated using the methodologies established by the U.S. Environmental Protection Agency (RTI International, 2010). The calculated values as well as the input parameters for the calculations are presented in Tables 2, 3 and the SI. The contribution of nitrous oxide to GHG emissions was not considered in this study. A previous study reporting about BETT systems demonstrated that the predominant denitrification reaction in BETT is the dissimilatory nitrate reduction to ammonium (DNRA) (Babanova et al., 2019). DNRA is also capable of the production of nitrous oxide. A more detailed evaluation is needed for the estimation of GHG emissions from nitrous oxide, which will be a subject to a separate study.
The estimated GHG emissions were compared to aerobic and anerobic wastewater treatment of the same organics’ removal e.g. 24,800 mg.L−1 COD removed, corresponding to 11,160 mg.L−1 BOD. BOD analysis of the brewery wastewater was periodically outsourced to an EPA certified lab to establish the BOD/COD ratio of 0.45. The data related to aerobic and anaerobic technologies was taken from literature (USDA, 2007; Lier et al., 2008; Haas et al., 2018). The data related to BETT Demo Unit were evaluated during the continuous mode of operation of the Demo Unit.
BETT technology provides 100% reduction in methane emissions, no methane is generated during BETT operation. BETT reactions are primarily anaerobic and include fermentation reactions to convert sugars to VFAs; however, unlike anaerobic digestion, the VFAs are oxidized to carbon dioxide using bacteria that naturally reduce solid-phase electron acceptors (Paquete et al., 2014). Further, protons and hydrogen are reacted at the cathode during oxygen reduction to generate hydrogen peroxide and/or molecular water. Due to these favorable reaction chemistries, the carbon dioxide and hydrogen partial pressures in BETT systems are not high enough to support methanogenic growth, Thus, methanogenic archaea are not involved in the process and no methane is generated.
The reduction in carbon dioxide emissions from biological activity were estimated to be 16 to 18% compared to anaerobic and aerobic technologies, respectively. This was a result of the lower biomass production and the higher fraction of COD converted under anaerobic conditions in BETT systems.
As me mentioned earlier, BETT systems have a significantly lower power demand relative to other wastewater treatment technologies due to the gravity feed and slow flow, low pressure operations of the system, which leads to low power demand equipment used. Due to the anaerobic nature of the oxidation process, no forced air is needed for the treatment also lowering the energy demand of the system. The power consumption of BETT Demo Unit was determined as 0.1–0.2 kWh.kg-BOD−1 removed depending on the season, where the power consumption was higher during the winter and lower during the summer months. The wastewater was heated to > 10°C during the winter months when needed, which contributes to the higher power consumption during this season. The low power requirements of BETT Demo Unit led to lower CO2 emissions from electricity consumption i.e. 80% lower emissions than anaerobic digestors and 95% lower emissions compared to aerobic treatment. BETT power requirement does not consider the energy recovered from BETT system since at this stage of BETT development, the voltage generated was used only as an indicator of reactor performance and was not harvested or used to offset the energy demand of the system. In the event of recovering the generated by BETT DC current, the energy demand of the system will be reduced even further by at least 30%.
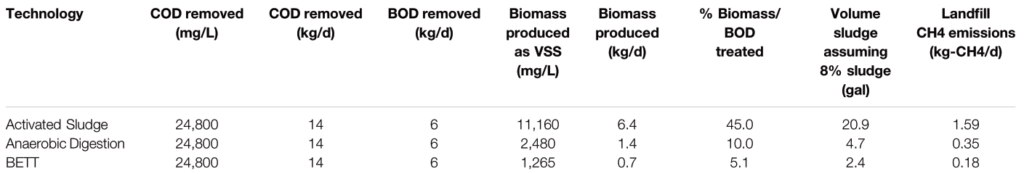
BETT technology produces significantly lower secondary biomass. The amount of secondary biomass produced is measured as VSS and was 5.1% of the total organics removed. The conversion of the chemical energy, the energy released during the oxidation of organics, into electrical energy in BETT systems reduces the energy available for bacterial growth resulting in a low biomass generation in these systems. Because of the lower biomass production, BETT contribution to landfill methane emissions is 89% lower than aerobic and 49% lower than conventional anaerobic technologies. The landfill CH4 emissions calculated as kg-CH4. d−1 were estimated to be 0.18 kg-CH4. d−1 for BETT Demo Unit, 0.35 kg-CH4. d−1 for ADs and 1.59 kg-CH4. d−1 for aerobic wastewater treatment plants. In 2015, 16.4% of the total methane emissions in the United States came from landfills (Meegoda et al., 2018).
TABLE 2 | Estimation of GHG emissions from power consumption and biological activity for BETT system and aerobic and anaerobic technologies processing identical BOD load.
How BETT Scales
One of the concerns that GWI Magazine expressed about the future of Microbial Fuel Cells as a wastewater treatment solution is the scalability of the technology due to the high cost of the materials and the issues arising with the larger anodes and cathodes (CTO, 2020). To overcome the problem with the electrode scalability, BETT takes advantage of the modularity approach. Instead of scaling up the reactor size, BETT systems rely on connecting multiple reactors in hydraulic series.
BETT Demo Unit is a small-scale pilot installation used for demonstration purposes. The Demo Unit has only 12 BETT reactors operating in hydraulic series, processing 0.6 m3. day−1 of wastewater. Due to the small number of reactors and the short HRT (4-h HRT), the wastewater is partially treated.
Commercial BETT systems, abbreviated here as C-BETT, are composed of one or multiple standard shipping containers with up to 640 BETT reactors working in multiple treatment trains. The shipping containers can be 6 m or 12 m depending on the volume of the wastewater to be treated. Each container follows similar to the BETT Demo Unit hydraulic profile. The major difference between the Demo Unit and a C-BETT systems are: 1) the number of BETT reactors connected in hydraulic series composing a “treatment train”; and 2) the number of treatment trains operating in parallel to increase processed volume.
BETT Demo Unit has one partial treatment train with 12 BETT reactors. C-BETT systems typically have 40 BETT reactors in hydraulic series to compose a single treatment train. The number of BETT reactors in a treatment train depends on the composition and concentration of the wastewater (COD loading), and the quality of the effluent to be achieved (targeted COD of the effluent) and can vary between 20 and 80 BETT reactors. Commercial BETT systems treating the wastewater used in this study should have at least 40 BETT reactors in hydraulic series.
TABLE 3 | Estimation of landfill GHG emissions for BETT system and aerobic and anaerobic technologies processing identical BOD load.
Each full-size treatment train can treat roughly between 0.6 and 1.40 m3 of wastewater. Therefore, to increase the volume of the processed wastewater, C-BETT systems have multiple treatment trains operating in parallel. Thus, a 12-m shipping container with 40 BETT reactors in a treatment train has 16 x treatment trains and can process roughly 9 m3. day−1 of high strength brewery wastewater.
To optimize space, the treatment trains are arranged on rack structures with multiple levels. Each level can have one or multiple treatment trains.
The modulatory of BETT systems allows for easy scale up, maintenance, repair, and expansion to address customer needs when they grow in production.
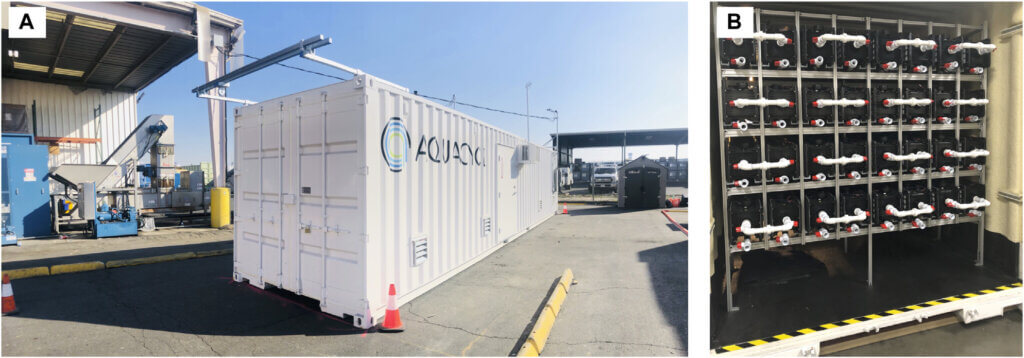
Figure 9 is showing how multiple BETT reactors are arranged in 12-m C-BETT system installed in February 2021 at a soda manufacturer customer site.
BETT systems might require the addition of a buffer solution such as phosphate or carbonate buffer (Liu et al., 2005; Nam et al., 2010). The buffer solution has a dual role to increase wastewater conductivity and increase pH:
Increasing the wastewater conductivity is needed when the raw wastewater has a conductivity < 1 mS cm−1.
Given the electrochemical nature of the reaction, higher conductivity will facilitate the proton flux from the anode to the cathode and thus enhance the cathodic reaction. Oxygen, protons and electrons combine at the cathode during the oxygen reduction reaction to result in the formation of water or hydrogen peroxide. The higher proton flux and faster proton utilization also helps with maintaining neutral pH around the anode units, which bacteria require.
The addition of buffer solution increases pH and provides buffering capacity. The higher buffering capacity of the solution also keeps the pH stable even at higher VFA concentrations.
BETT systems use sodium bicarbonate to create bicarbonate buffer system. Sodium bicarbonate was specifically selected because the lack of toxicity and low cost.
The addition of sodium bicarbonate is not required for all BETT systems. It is defined by the composition of the wastewater and the natural buffering capacity of the raw wastewater. Wastewater with low conductivity (conductivity < 1 ms cm−1) and high organic content (COD > 10,000 mg.L−1) will require the addition of sodium bicarbonate. Wastewater with conductivity > 1 ms cm−1 and lower organic content (COD < 10,000 mg.L−1) might not require the addition of sodium bicarbonate.
CONCLUSION
BETT systems are the cleanest and most efficient approach for directly treating high strength wastewater (COD > 25,000 mg.L−1) and are an effective solution for a Net-Zero future.
This study successfully demonstrated the applicability of BETT technology for the treatment of wastewater with high, and highly variable, concentrations of COD, protein and TSS. BETT achieved up to 33% COD removal corresponding to COD of 22,175 mg.L−1 in a 4-h HRT. The TSS removal reached values as high as 79% with incoming TSS concentrations up to 34,000 mg.L−1 TSS. No other wastewater treatment technology has been reported to efficiently remove such high organic and solids concentrations.
In addition, BETT Demo Unit demonstrated 89 and 49% lower landfill methane emissions than aerobic and anaerobic technologies, respectively. The overall reduction in CO2 emissions, both direct and indirect, was estimated to be 85–90% lower compared to existing practices.
DATA AVAILABILITY STATEMENT
The original contributions presented in the study are included in the article/Supplementary Material, further inquiries can be directed to the corresponding author.
AUTHOR CONTRIBUTIONS
SB and OB designed and managed the study and wrote the manuscript. JJ, KW, and JS collected the data. JG, DB, PH, OA, RN, and GG designed the system. All authors contributed to manuscript revision, read, and approved the submitted version.
SUPPLEMENTARY MATERIAL
The Supplementary Material for this article can be found online at: https://www.frontiersin.org/articles/10.3389/fceng.2022.832505/full#supplementary-material
REFERENCES
Babanova, S., Jones, J., Phadke, S., Lu, M., Angulo, C., Garcia, J., et al. (2019). Continuous Flow, Large-scale, Microbial Fuel Cell System for the Sustained Treatment of Swine Waste. Water Environ. Res. 92, 60–7213. doi:10.1002/wer.1183
Babanova, S., Jones, J., Wiseman, K., Soles, J., Garcia, J., Huerta, P., et al. (2020).
Electrifying Pretreatment. Water Environ. Technol. 31, 35–41.
Babanova, S. (2020). New Perspectives in Sugar Industry Wastewater Treatment.
Bidault, F., Brett, D. J. L., Middleton, P. H., and Brandon, N. P. (2009). Review of Gas Diffusion Cathodes for Alkaline Fuel Cells. J. Power Sourc. 187, 39–48. doi:10.1016/j.jpowsour.2008.10.106
Bracmort, K. (2010). Anaerobic Digestion: Greenhouse Gas Emission Reduction and Energy Generation. Washington D.C: Congressional Research Service, 1–13.
Buchanan, J., and Seabloom, R. (2004). Aerobic Treatment of Wastewater and Aerobic Treatment Units. University Curriculum Development for Decentralized Wastewater Management. http://onsite.tennessee.edu/Aerobic%20Treatment%20&%20ATUs.pdf
Campos, J. L., Valenzuela-Heredia, D., Pedrouso, A., Val del Río, A., Belmonte, M., and Mosquera-Corral, A. (2016). Greenhouse Gases Emissions from Wastewater Treatment Plants: Minimization, Treatment, and Prevention. J. Chem. 2016, 1–12. doi:10.1155/2016/3796352
Chen, S., Harb, M., Sinha, P., and Smith, A. L. (2018). Emerging Investigators Series: Revisiting Greenhouse Gas Mitigation from Conventional Activated Sludge and Anaerobic-Based Wastewater Treatment Systems. Environ. Sci. Water Res. Technol. 4, 1739–1758. doi:10.1039/c8ew00545a
Chung, K., and Okabe, S. (2009). Continuous Power Generation and Microbial Community Structure of the Anode Biofilms in a Three-Stage Microbial Fuel Cell System. Appl. Microbiol. Biotechnol. 83, 965–977. doi:10.1007/s00253-009-1990-z
CTO (2020). What Happened to Microbial Fuel Cells? GWI Mag., 41–43. Dong, Y., Qu, Y., He, W., Du, Y., Liu, J., Han, X., et al. (2015). A 90-liter Stackable
Baffled Microbial Fuel Cell for Brewery Wastewater Treatment Based on
Energy Self-Sufficient Mode. Bioresour. Techn. 195, 66–72. doi:10.1016/j. biortech.2015.06.026
Du, Z., Li, H., and Gu, T. (2007). A State of the Art Review on Microbial Fuel Cells: A Promising Technology for Wastewater Treatment and Bioenergy. Biotechnol. Adv. 25, 464–482. doi:10.1016/j.biotechadv.2007.05.004
Erable, B., Féron, D., and Bergel, A. (2012). Microbial Catalysis of the Oxygen Reduction Reaction for Microbial Fuel Cells: A Review. ChemSusChem 5, 975–987. doi:10.1002/cssc.201100836
Evren, M., Ozgun, H., Kaan, R., and Ozturk, I. (2011). Anaerobic Treatment of Industrial Effluents: An Overview of Applications. Istanbul: Waste Water – Treat. Reutil. doi:10.5772/16032
Feng, Y., Wang, X., Logan, B. E., and Lee, H. (2008). Brewery Wastewater Treatment Using Air-Cathode Microbial Fuel Cells. Appl. Microbiol. Biotechnol. 78, 873–880. doi:10.1007/s00253-008-1360-2
Franke-Whittle, I. H., Walter, A., Ebner, C., and Insam, H. (2014). Investigation into the Effect of High Concentrations of Volatile Fatty Acids in Anaerobic Digestion on Methanogenic Communities. Waste Manage. 34, 2080–2089. doi:10.1016/j.wasman.2014.07.020
Gude, V. G. (2016). Wastewater Treatment in Microbial Fuel Cells – an Overview.
J. Clean. Prod. 122, 287–307. doi:10.1016/j.jclepro.2016.02.022
Haas, D. d., Appleby, G., Charakos, G., and Dinesh, N. (2018). Benchmarking Energy Use for Wastewater Treatment Plants. Water e-Journal 3, 1–26. doi:10. 21139/wej.2018.023
He, L., Du, P., Chen, Y., Lu, H., Cheng, X., Chang, B., et al. (2017). Advances in Microbial Fuel Cells for Wastewater Treatment. Renew. Sustain. Energ. Rev. 71, 388–403. doi:10.1016/j.rser.2016.12.069
He, Z., Huang, Y., Manohar, A. K., and Mansfeld, F. (2008). Effect of Electrolyte pH on the Rate of the Anodic and Cathodic Reactions in an Air-Cathode Microbial Fuel Cell. Bioelectrochemistry 74, 78–82. doi:10.1016/j.bioelechem.2008.07.007
Henze, M., Harremoes, P., Jansen, J. la. C., and Arvin, E. (1995). in Wastewater Treatment. Editors U. Forstner, R. J. Murphy, and W. H. Rulkens Spronger. 3rd ed. (New York: Springer-Verlag Berlin Heidelberg)
Lier, J. B. V., Mahmoud, N., and Zeeman, G. (2008). Anaerobic Wastewater Treatment. doi:10.1021/es00154a002
Liu, H., Cheng, S., and Logan, B. E. (2005). Power Generation in Fed-Batch Microbial Fuel Cells as a Function of Ionic Strength, Temperature, and Reactor Configuration. Environ. Sci. Technol. 39, 5488–5493. doi:10.1021/es050316c
Lofrano, G., and Brown, J. (2010). Wastewater Management through the Ages: A History of Mankind. Sci. Total Environ. 408, 5254–5264. doi:10.1016/j.scitotenv.2010.07.062
Logan, B. E. (2009). Exoelectrogenic Bacteria that Power Microbial Fuel Cells. Nat.
Rev. Microbiol. 7, 375–381. doi:10.1038/nrmicro2113 Mamais, D., Noutsopoulos, C., Dimopoulou, A., Stasinakis, A., and Lekkas, T. D. (2015).
Wastewater Treatment Process Impact on Energy Savings and Greenhouse Gas Emissions. Water Sci. Technol. 71, 303–308. doi:10.2166/wst.2014.521
McCarty, P. L., Bae, J., and Kim, J. (2011). Domestic Wastewater Treatment as a Net Energy Producer-Can This Be Achieved? Environ. Sci. Technol. 45, 7100–7106. doi:10.1021/es2014264
Meegoda, J., Li, B., Patel, K., and Wang, L. (2018). A Review of the Processes, Parameters, and Optimization of Anaerobic Digestion. Ijerph 15, 2224. doi:10.3390/ijerph15102224
Moeller, L., and Zehnsdorf, A. (2016). Process Upsets in a Full-Scale Anaerobic Digestion Bioreactor: Over-acidification and Foam Formation during Biogas Production. Energ Sustain. Soc. 6. doi:10.1186/s13705-016-0095-7
Mussatto, S. I. (2014). Brewer’s Spent Grain: a Valuable Feedstock for Industrial Applications. J. Sci. Food Agric. 94, 1264–1275. doi:10.1002/jsfa.6486
Nam, J.-Y., Kim, H.-W., Lim, K.-H., Shin, H.-S., and Logan, B. E. (2010). Variation of Power Generation at Different Buffer Types and Conductivities in Single Chamber Microbial Fuel Cells. Biosens. Bioelectron. 25, 1155–1159. doi:10.1016/j.bios.2009.10.005
Paquete, C. M., Fonseca, B. M., Cruz, D. R., Pereira, T. M., Pacheco, I., Soares, C. u. M., et al. (2014). Exploring the Molecular Mechanisms of Electron Shuttling across the Microbe/metal Space. Front. Microbiol. 5, 1–8. doi:10.3389/fmicb.2014.00318
Rothausen, S. G. S. A., and Conway, D. (2011). Greenhouse-gas Emissions from Energy Use in the Water Sector. Nat. Clim Change 1, 210–219. doi:10.1038/nclimate1147
RTI International (2010). Greenhouse Gas Emissions Estimation Methodologies for Biogenic Emissions from Selected Source Categories. Available at: http://www3.epa.gov/ttn/chief/efpac/ghg/GHG_Biogenic_Report_draft_Dec1410.pdf.
Sun, Q., Wu, Y., Zhao, L., and Sun, Q. (2010). Production of Electricity from the Treatment of Continuous Brewery Wastewater Using a Microbial Fuel Cell. Fuel 89, 1381–13856. doi:10.1016/j.fuel.2009.11.004
The Eight Report Of The Royal Commission On Sewage Disposal (1912). Lancet 180, 1530–1531.
Trapero, J. R., Horcajada, L., Linares, J. J., and Lobato, J. (2017). Is Microbial Fuel Cell Technology Ready? an Economic Answer towards Industrial Commercialization. Appl. Energ. 185, 698–707. doi:10.1016/j.apenergy.2016.10.109
United States Environmental Protection Agency (1992). Determining Wastewater User Service Charge Rates. Available at: https://nepis.epa.gov/Exe/ZyNET.exe/200041G5.txt?ZyActionD=ZyDocument&Client=EPA&Index=1991 Thru1994&Docs=&Query=&Time=&EndTime=&SearchMethod=1&TocRestrict=n&Toc=&TocEntry=&QField=&QFieldYear=&QFieldMonth=&QFieldDay=&UseQField=&IntQFieldOp=0&ExtQFieldOp=.
USDA (2007). An Analysis of Energy Production Costs from Anaerobic Digestion Systems on U . S . Livestock Production Facilities.
Verstraete, W., and Rabaey, K. (2006). {REW} Microbial Fuel Cells : Methodology and Technology. Environ. Sci. Technol. 40, 5181–5192. doi:10.1021/es0605016 Wang, X., Feng, Y. J., and Lee, H. (2008). Electricity Production from Beer Brewery Wastewater Using Single Chamber Microbial Fuel Cell. Water Sci. Technol. 57, 1117–1121. doi:10.2166/wst.2008.064
Zaks, D. P. M., Winchester, N., Kucharik, C. J., Barford, C. C., Paltsev, S., and Reilly, J. M. (2011). Contribution of Anaerobic Digesters to Emissions Mitigation and Electricity Generation under U.S. Climate Policy. Environ. Sci. Technol. 45, 6735–6742. doi:10.1021/es104227y
Zhuang, L., Yuan, Y., Wang, Y., and Zhou, S. (2012). Long-term Evaluation of a 10- liter Serpentine-type Microbial Fuel Cell Stack Treating Brewery Wastewater. Bioresour. Techn. 123, 406–412. doi:10.1016/j.biortech.2012.07.038
Conflict of Interest: SB, JJ, KW, JS, and OB are employed by Aquacycl Inc. JG, PH, DB, RN, OA, and GG are employed by D4C Product Development. Aquacycl Inc. was the leading entity in the research and D4C Product Development was contracted by Aquacycl for the design efforts.The work described in this study is owned by Aquacycl Inc. D4C Product Development was a subcontractor to Aquacycl during this test. The funding for the study was solely provided by Aquacycl Inc. The funder had the following involvement with the study: manufactured, commissioned, operated, and collected and processed the data for the study.
Publisher’s Note: All claims expressed in this article are solely those of the authors and do not necessarily represent those of their affiliated organizations, or those of the publisher, the editors and the reviewers. Any product that may be evaluated in this article, or claim that may be made by its manufacturer, is not guaranteed or endorsed by the publisher.
Copyright © 2022 Babanova, Jones, Wiseman, Soles, Garcia, Huerta, Barocio, Naito, Arreola, Garcia and Bretschger. This is an open-access article distributed under the terms of the Creative Commons Attribution License (CC BY). The use, distribution or reproduction in other forums is permitted, provided the original author(s) and the copyright owner(s) are credited and that the original publication in this journal is cited, in accordance with accepted academic practice. No use, distribution or reproduction is permitted which does not comply with these terms.